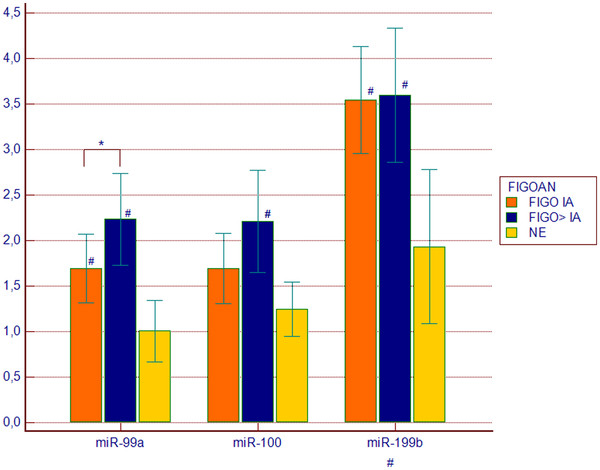
Figure 4.

Expression of miR-99a, miR-100 and miR-199b in endometrioid endometrial cancer (EEC) plasma samples in groups distinguished based on FIGO stage. FIGOIA (n = 17), FIGO > IA (n = 17), NE, normal endometrium (n = 14). Values are presented in the log scale; * p = 0.039, # p < 0.05
