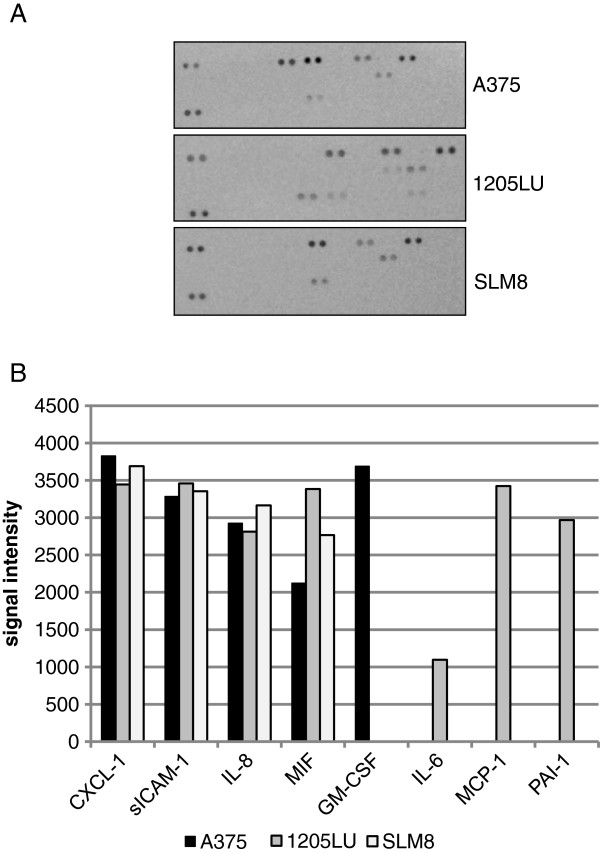
Figure 5.
Melanoma cell lines display different cytokine expression profiles.A Melanoma cells were cultured for 24hrs in 12ml of DMEM added with 10% FCS. The supernatant was next tested for the presence of 36 different cytokines. B The histograms represent the quantification by Image J software of the spots obtained on the nitrocellulose membranes. Data were obtained from 2 independent experiments.

