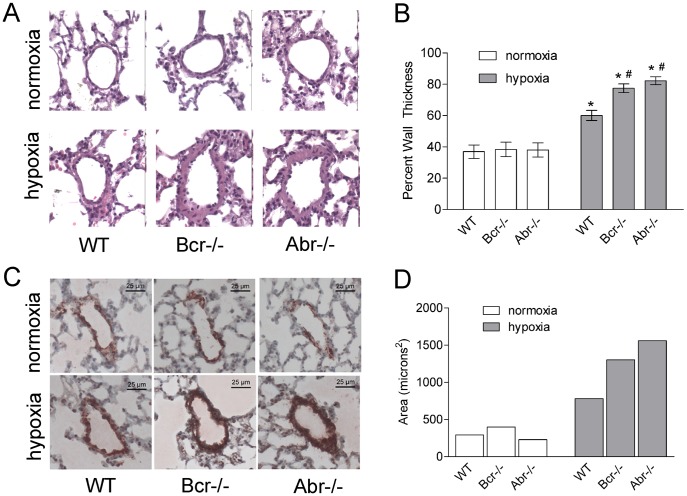
Figure 2. Hypoxia-induced pulmonary vascular remodeling in bcr−/− and abr−/− mice.
A, Hematoxylin and eosin staining on representative lung specimens from bcr−/−, abr−/− and wt mice under normoxia or hypoxia. Note that the walls of the pulmonary arteries of the bcr−/− and abr−/− mice are remarkably thicker than those of the wt mice after hypoxia. Magnification, 200×. B, Quantification of changes in the pulmonary artery walls. Percent wall thickness was determined on H&E stained sections as described in Methods on nine vessels of comparable size per mouse, with 6 mice per genotype per condition. *p<0.05 compared with the same genotype at normoxia. # p<0.05 compared with WT mice in the same exposure condition. Bars, mean ± SD. C, Immunostaining with α-SMA antibodies on pulmonary vessels from representative normoxia or hypoxia-treated mice. D, Quantification of areas for α-SMA-positive cells. Areas of α-SMA-positive cells were calculated using ImageJ software as described in the Materials and Methods.

