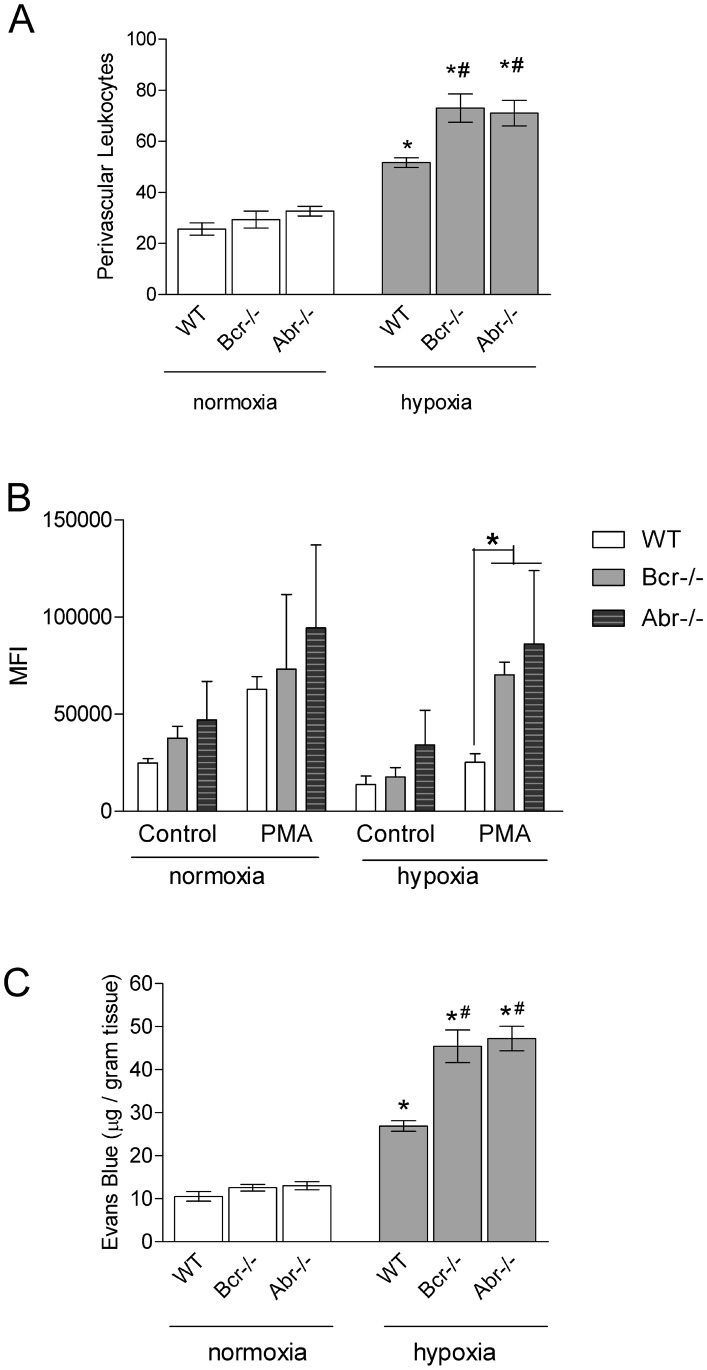
Figure 3. Lack of Abr and Bcr function exacerbates hypoxia-induced leukocyte involvement in PH. A,
Numbers of perivascular leukocytes surrounding terminal arterioles. Data are expressed as total leukocyte counts per high-power field (200× amplification). Bars, mean+SEM. n = 3/group. B, Peritoneal-elicited macrophages exposed to normoxia or hypoxia for 24 hours activated with 1 µM PMA. ROS production was measured by FACS 1 hr later. Controls, cells without PMA activation. Bars, mean+SEM. n = 5 mice/group. *, p<0.05. MFI, mean fluorescent intensity. C, Vascular leakage. Evans blue was injected when mice had been exposed to normoxia or hypoxia for 3 weeks. Bars, mean+SEM. n = 3–4 mice/group. A and C, *p<0.05 comparison between animals of the same genotype at normoxia. #p<0.05 compared to WT mice exposed to the same condition.

