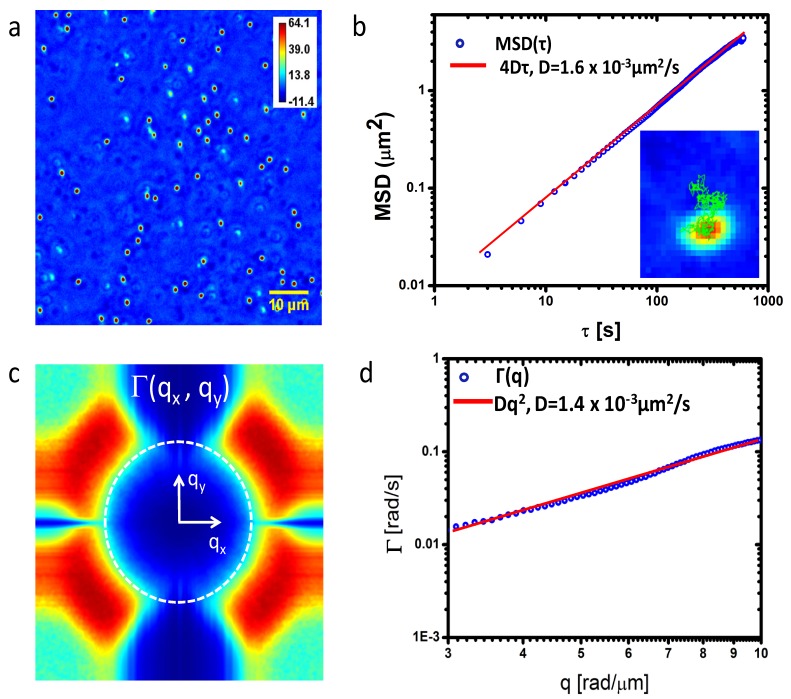
Fig. 2.
a) Quantitative phase image of 1μm polystyrene beads in glycerol. Colorbar indicates pathlength in nm. b) Mean squared displacements (MSD) obtained by tracking individual beads in a. The inset illustrates the trajectory of a single bead. c) Decay rate vs. spatial mode, Γ(q), associated with the beads in a. The dash ring indicates the maximum q values allowed by the resolution limit of the microscope. d) Azimuthal average of data in c) to yield Γ(q). The fits with the quadratic function yields the value of the diffusion coefficient as indicated.

