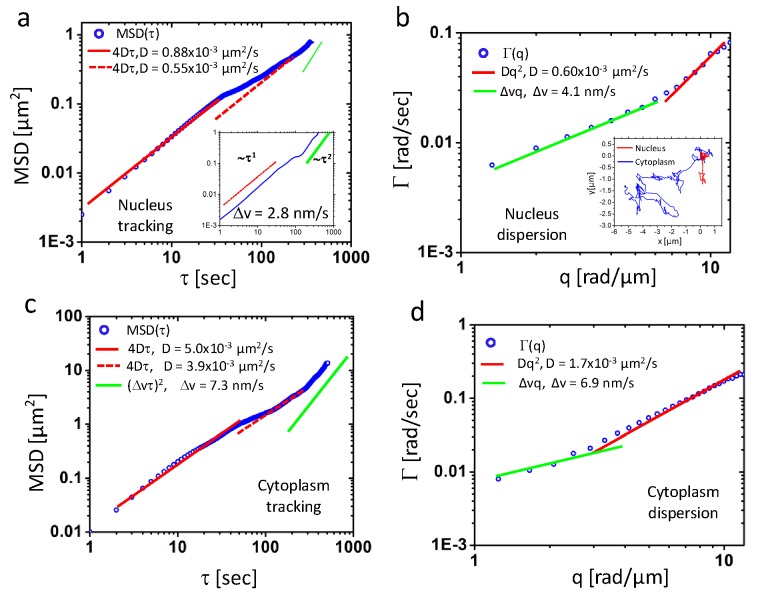
Fig. 4.
a) and c) MSD ensemble-averaged over 7 and 6 particles in nucleus and cytoplasm regions, respectively, as indicated in Fig. 3g by the red and blue boxes. Corresponding fits give diffusion coefficients and standard deviation of drift velocity. Inset in a) shows the MSD for a particle in log scale where directed motion is indicated by green line. b) and d) are dispersion curves for the same area of a) and c. Inset are trajectories of two particles denoted by black arrow in Fig. 3 g). The blue one is the particle at cytoplasm and red one is inside nucleus.

