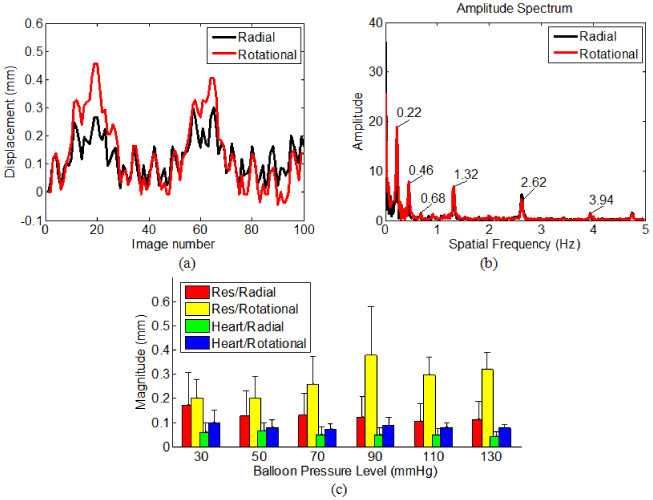
Fig. 6.

(a) The radial and rotational motions measured from a representative 2-D image sequence (first 100 images). (b) The amplitude spectra of (a). (c) The mean and standard deviation of both physiological motions (respiration and heart beat) in both the radial and rotational directions, at six levels of balloon pressure.
