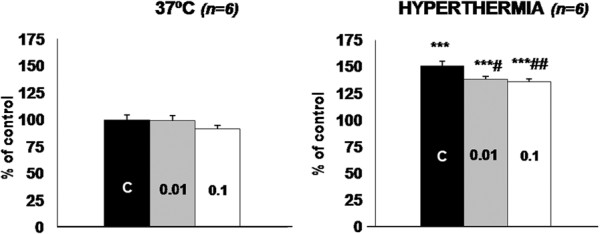
Figure 1.

Effect of theophylline on the proteolytic rate of C2C12 cells under hyperthermia. Values for protein degradation are presented as the percentage of the respective control value at 37°C of the amino acid radioactivity in the medium versus the total radioactivity incorporated into protein (for further details, see the Material and Methods section). All data are means ± SEM. The number inside the bars represents the concentration of theophylline (mM). Values that are significantly different by one-way ANOVA (post-test Duncan), from the control (non treated) group are indicated by: # p < 0.05, ## p < 0.01. Values that are significantly different by one-way ANOVA (post-test Duncan) from hyperthermia are indicated by: *** p < 0.001.
