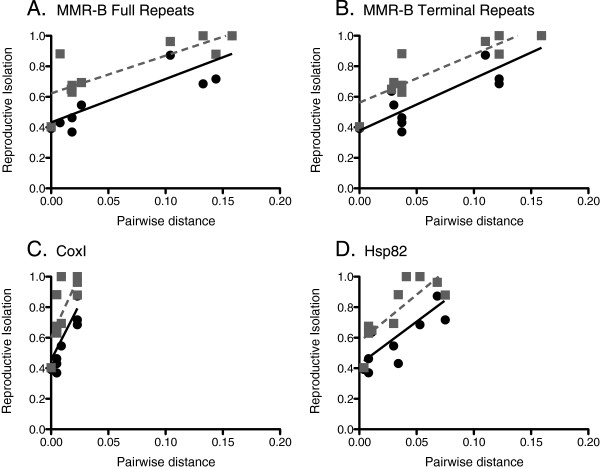
Figure 9.
Correlations between reproductive isolation and genetic distance. (A) mmr-b full repeats; (B) mmr-b terminal repeats; (C) coxI; and (D) hsp82. Black circles represent reproductive isolation calculated from percent circling; grey squares indicate reproductive isolation calculated from percent copulation.

