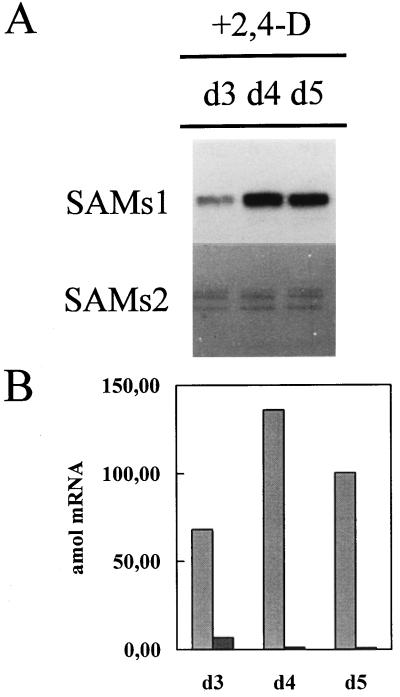
Figure 5.
Effect of 2,4-D treatment on d 0 on SAMS expression in unpollinated pea ovaries. A, Ten micrograms of total RNA extracted from 2,4-D-treated pea ovaries was hybridized to SAMS gene-specific RNA probes, and RPA was performed. d3 to d5, Days with respect to anthesis. B, Quantification of the SAMS mRNAs at the stages shown in A. SAMS transcript levels were quantified using a radioanalytical imaging system. Light gray bars, SAMS1; dark gray bars, SAMS2. The data were corrected for the number of uracil residues within each probe.

