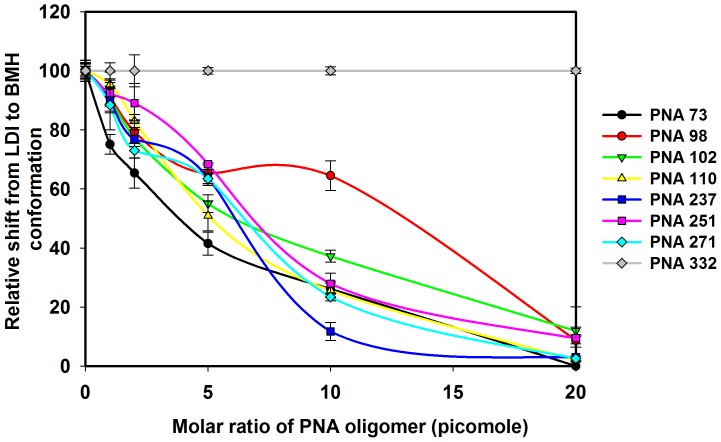
Figure 12. PNA effect on the equilibrium between the LDI and BMH conformations of HIV-1 leader RNA.
The RNA samples from conformer assays were analyzed on the non-denaturing gels and the intensity of bands corresponding to the LDI and BMH conformers on each gel was quantified. The relative shift from LDI to BMH conformation was calculated as e/E × 100%, where ‘e’ is the percentage intensity of LDI conformer in TEN buffer with different concentration of PNA oligomer and ‘E’ is the percentage intensity of LDI conformer in TEN buffer without PNA oligomers. Error bars indicate standard deviation of triplicate runs.

