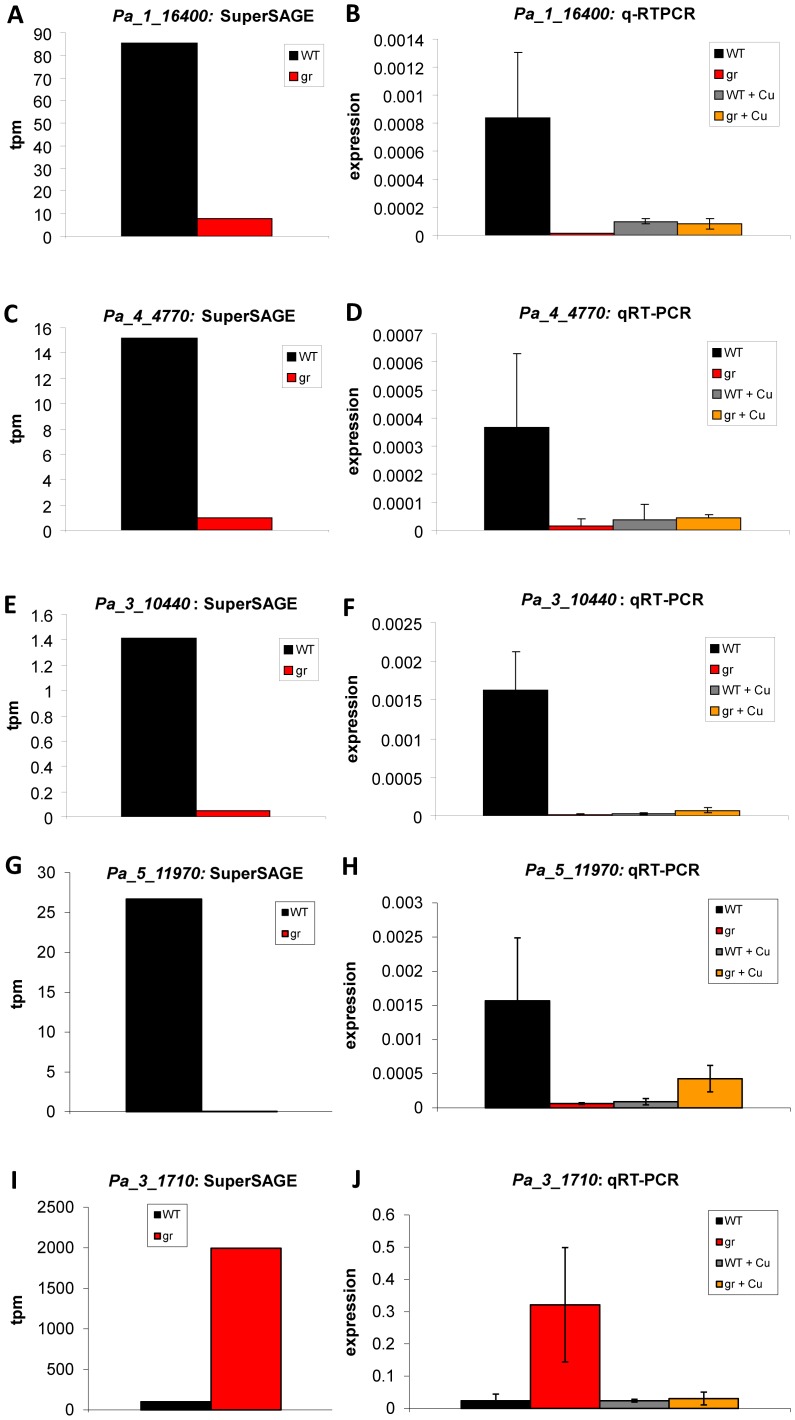
Figure 1. Transcript analysis of Pa_1_16400 (PaCtr1: A, B), Pa_4_4770 (PaCtr2: C, D), and Pa_3_10440 (PaCtr3: E, F), Pa_5_11970 (G, H), Pa_3_1710 (I, J).
Results from the SuperSAGE analysis (A, C, E, G, I) are shown as ‘tags per million’ (tpm) for wild type (WT) and grisea (gr). The results of the qRT-PCR (B, D, F, H, J) are relative expression levels of the three copper transporter genes of the wild type (WT, n = 5 in B, D, F, J; n = 6 in H) and the grisea mutant (gr, n = 6) grown in standard medium, and wild type (WT+Cu, n = 3) and grisea (gr+Cu, n = 3) grown on copper-supplemented medium, normalized to the expression level of the gene coding for mitochondrial PORIN The error bars represent the standard deviation.

