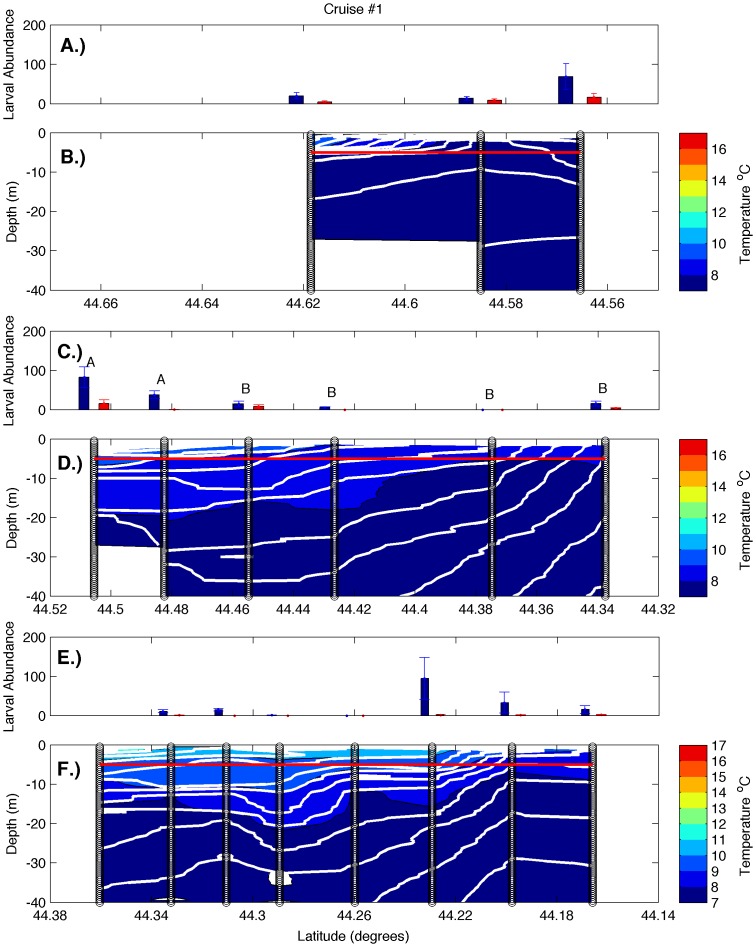
Figure 2. Larval abundance and water column structure on June 8–10, 2010.
Panels represent larval abundance and water column structure, respectively, for transects 1 (A, B), 2 (C, D), and 3 (E, F). Larval abundance is presented as larvae m−3 at 5 m (blue bars) and 0.25 m (red bars). Error bars represent one standard error. The red line indicates the depth at which 5 m samples were collected. Variation in larval density among stations was only significant on transect 2 (one-way ANOVA, p<0.005), and letters indicate 5 m stations that did not differ significantly from one another (Tukey-Kramer post-hoc test, p>0.05). Vertical black lines represent the locations of CTD and larval sampling stations, color gradations represent water temperatures, and the white contour lines represent isopycnals.

