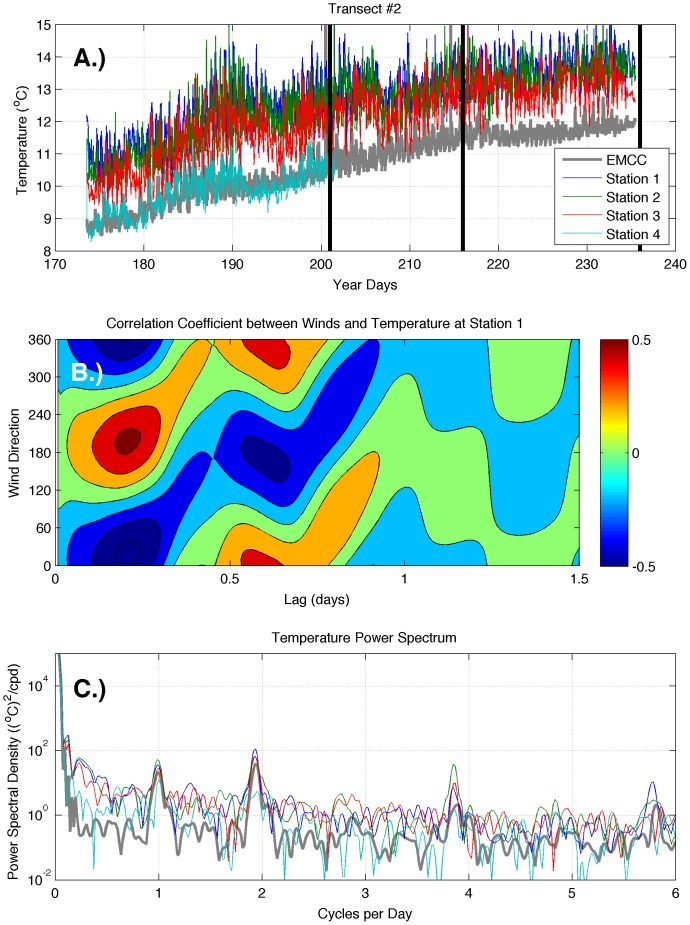
Figure 7. Temperature time series data (A) and analysis (B, C) for transect 2.
The two analysis panels present wind-temperature correlations (B), and the power spectra of surface temperature (C). Station numbers begin near the coast and increase offshore. Vertical black lines indicate times of cruises. Note that wind direction refers to the direction that wind is blowing from.

