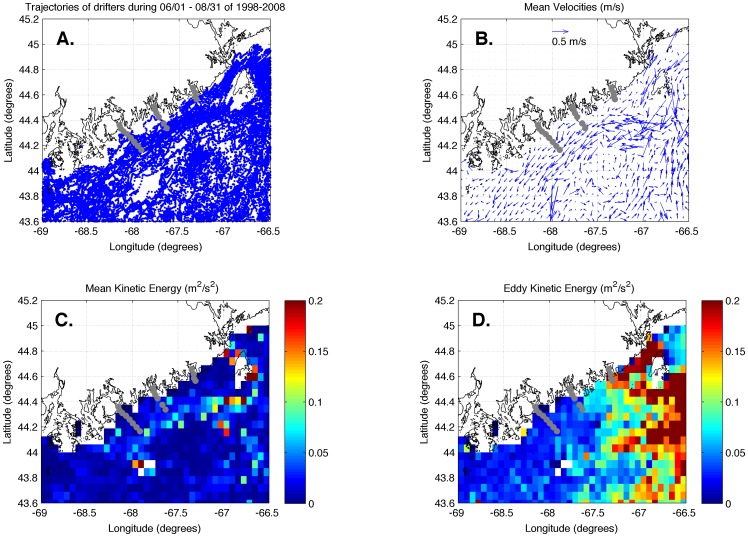
Figure 9. Trajectories (A) and analysis (B, C, D) of surface and drogued drifter data.
The three analysis panels present mean velocities (B), mean kinetic energy (C), and eddy kinetic energy (D) calculated from drifters entering the study region from June 1 – August 31 of 1998–2009. Gray circles indicate CTD and larval sampling stations.

