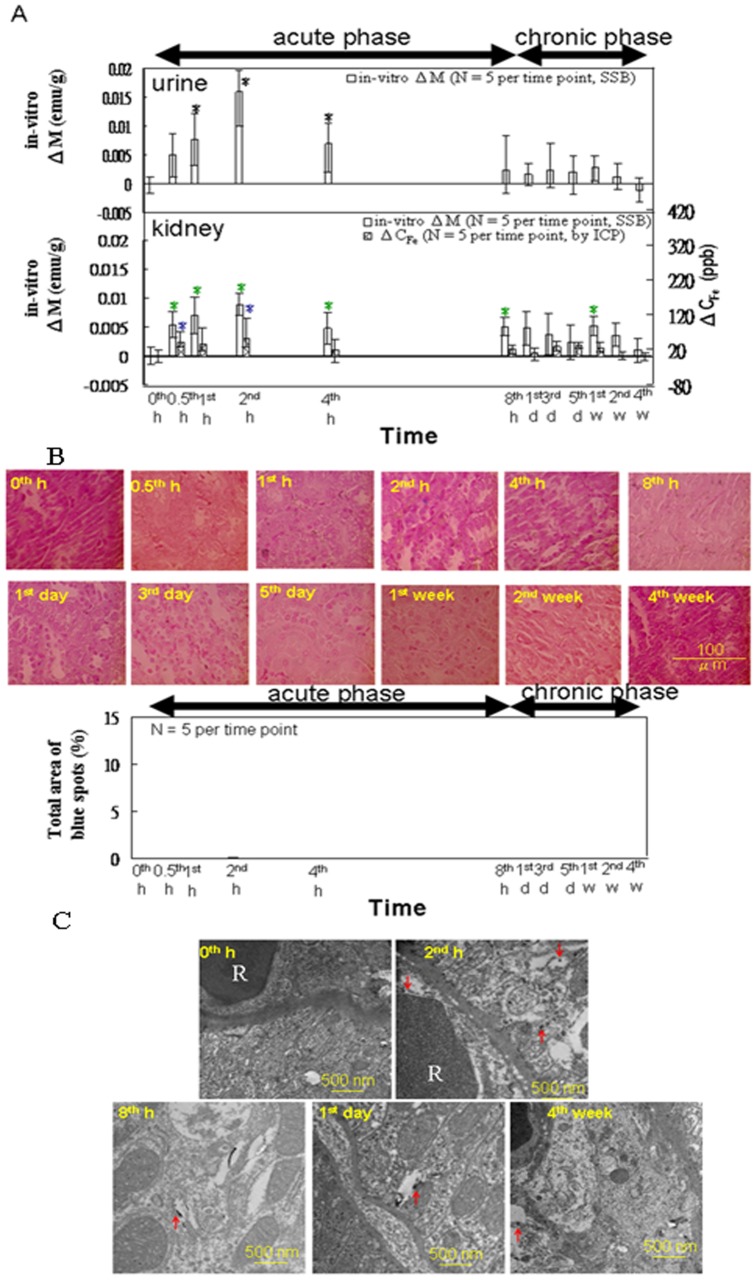
Figure 7. In vitro examination of particle excretion in the kidney.
(A) The in vitro magnetic SSB measurements of the urine and kidney tissues versus the ICP test results for the kidney tissue (from 0 h to 4 wk, n = 5). (B) Prussian blue staining of the kidney tissue (from 0 h to 4 wk, n = 5). (C) TEM images of representative macrophages in the kidney specimens of the rats injected with the MNPs at 0 h, 2 h, 8 h, 1 d, and 4 wk. The arrows indicate the MNPs (Scale bars: 500 nm). Within the varying time points in each methodology, star (*) denote significant differences in the data that are presented (p<0.05).

