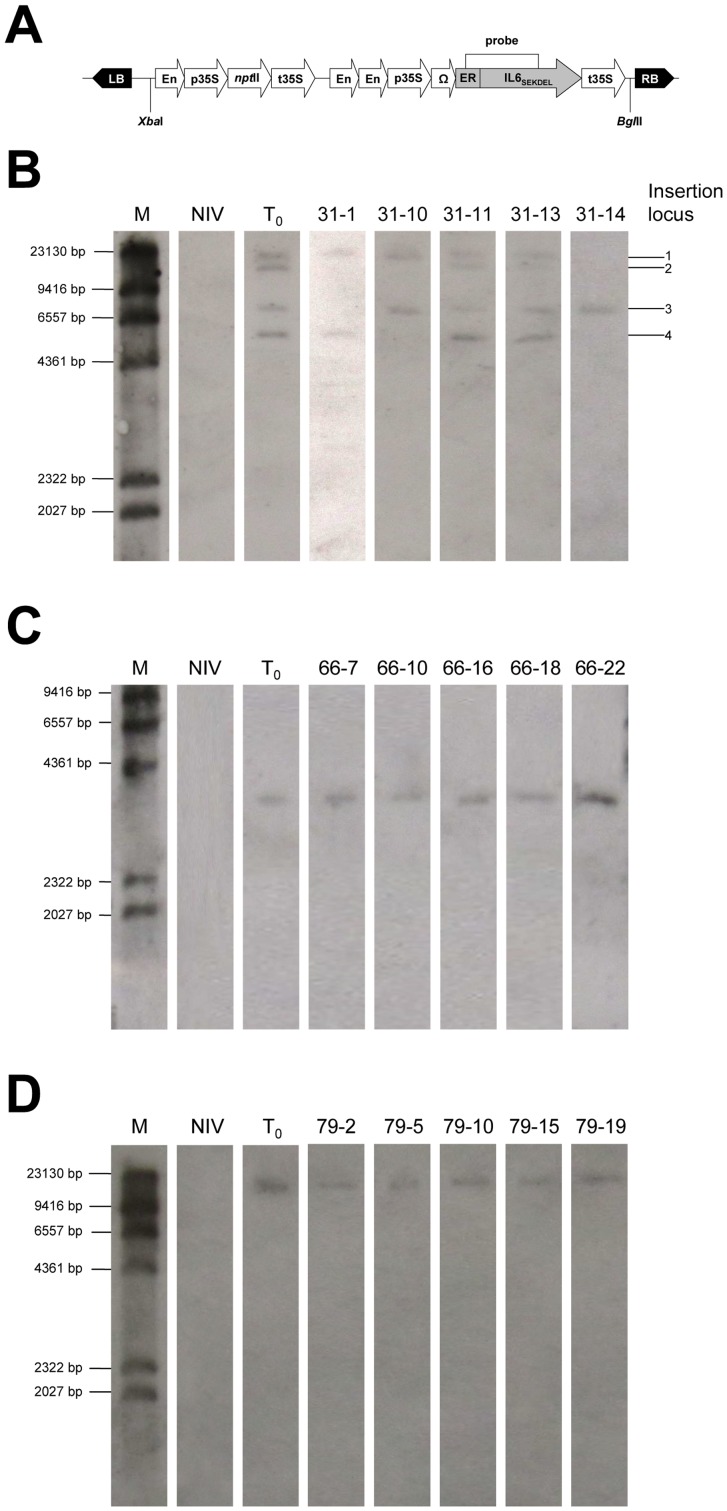
Figure 6. Southern blot analysis of T0 parents and selected T1 progeny from the transgenic IL6ER lines.
Chromosomal DNA was digested with BglII, cutting cut once in the expression cassette. M: DIG-labeled DNA Molecular Weight Marker II (Roche); NIV: Untransformed negative control; Numbered lanes represent T1 individuals. (A) Schematic representation of the integrated T-DNA structure and the probe position. (B) Southern blot of line IL6ER 31. (C) Southern blot of the line IL6ER 66. (D) Southern blot of the line IL6ER 79.

