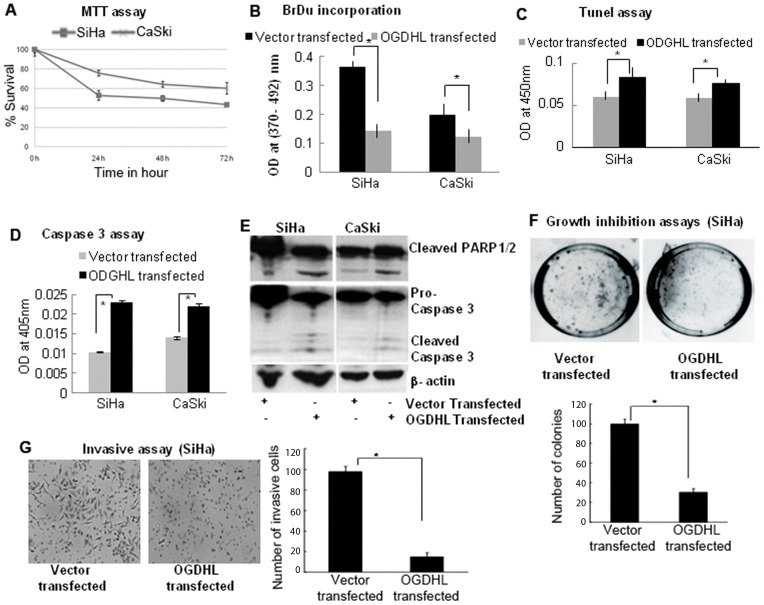
Figure 3. Phenotypic alterations of cells after forceful expression of OGDHL.
A. MTT assay: Significantly decreased numbers of SiHa and CaSki cells were observed after forceful expression of OGDHL in a time dependent manner (after 0, 24, 48 and 72 h of transfection). Cell growth rate is expressed as absorbance at 570 to 650 nm (* P <0.001).; B. BrdU assay: OGDHL inhibit cell proliferation of SiHa and Caski cells as detected by DNA synthesis (*P<0.001 and 0.001 for SiHa and CaSki cells respectively); C. Tunel assay: Forty-eight hours after transfection of OGDHL, the ratio of apoptotic versus total number of cells was evaluated by TUNEL assay. Significant differences were observed between OGDHL and mock transfected cells (*P<0.001 and 0.001 for SiHa and CaSki cell lines respectively); D. Caspase 3 assay: Caspase-3 activity was measured using the Caspase colorimetric assay kit in SiHa and CaSki cells 48 hours after mock or OGDHL-transfection. (*P<0.001,**P<0.001 respectively); E. Immunoblot analysis: Cleaved Caspase 3 and PARP1/2 were observed in SiHa and CaSki cell lines after overexpression of OGDHL; F. Colony formation assay: The effect of exogenous OGDHL expression in colony formation of SiHa cell line. The SiHa cell line was transfected with constructs encoding OGDHL or the empty vector. Cells were harvested 24 h after transfection, and equal cell numbers were seeded in 100 mm dishes and grown under selection in G418 for 21 days. The representative photograph after 21 days (left) and the quantification of the number of G418 selected SiHa cell colonies counted in 3 plates (right). The vector control was set at 100%. The data represent the mean ±SD of three independent experiments, each done in triplicate. G. Invasive assay: SiHa cells 48 hours after transient transfection of OGDHL and empty vector. Cells that invaded the polycarbonate membrane of transwell chamber (Left). The number of cells that invaded the polycarbonate membrane of transwell chamber (right) (*P<0.001). The data represent the mean ±SD of three independent experiments, each done in triplicate.

