
Fig. 5. Inhibition of ROS production with NOX2 agonist Ang II in vitro and in vivo.
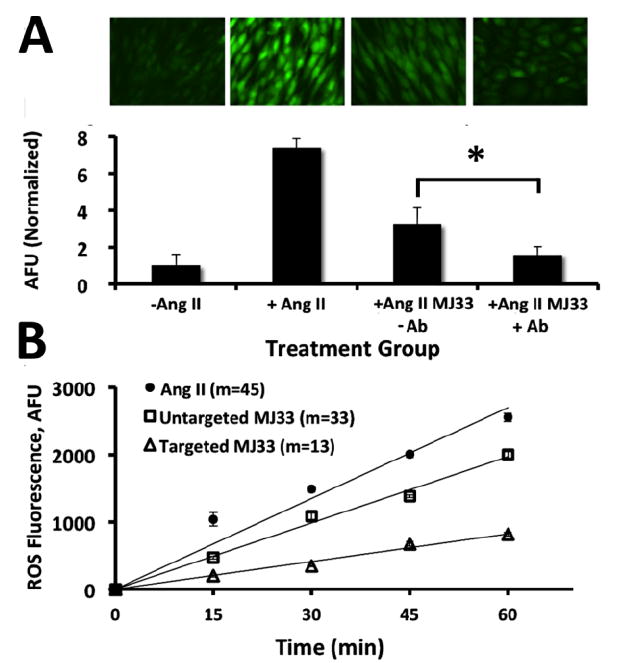
(a) Fluorescence from DCFDA dye representing ROS generation in Ang II treated MS1 cells. Representative fluorescent images in each treatment group taken 10 mins after adminstration of Ang II to ensure equivalance of potential ROS generation. Images left to right: (1) Untreated; (2) Ang II treatment, no MJ33; (3) Ang II + untargeted MJ33 liposomes;(4) Ang II + PECAM targeted MJ33 liposomes (b) Corresponding quantifications of fluorescence. Normalized relative to the untreated control. Quantification based on no less than 6 images. Error bars represent standard deviation. Significance between targeted and untargeted *p < 0.001. (c) Inhibition of ROS production in Ang II (50 mM) treated isolated perfused lung model. Reduction of ROS 2.5 fold by targeted MJ33 liposomes over untargeted from lung perfusate. Fluorescence generated from reaction of Amplex Red with ROS. Values shown represent slopes of the linear regression of the time vs FL units relative to untreated controls. Error bars represent standard deviation. n=3.