
Figure 3.
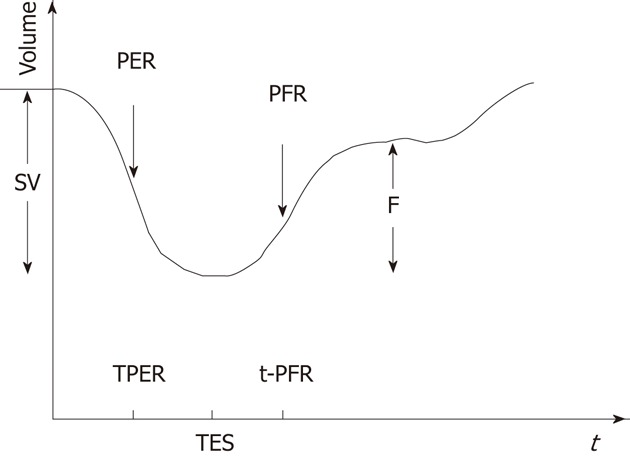
Left ventricular time activity curve from the first derivative showing different phases of cardiac cycle and parameters obtained. SV: Stroke volume; PER: Peak emptying rate; TPER: TIme at peak emptying rate; PFR: Peak filling rate; t-PFR: Time to peak filling rate; TES: Time to end of systole; F: Part of SV achieved during rapid filling rate.