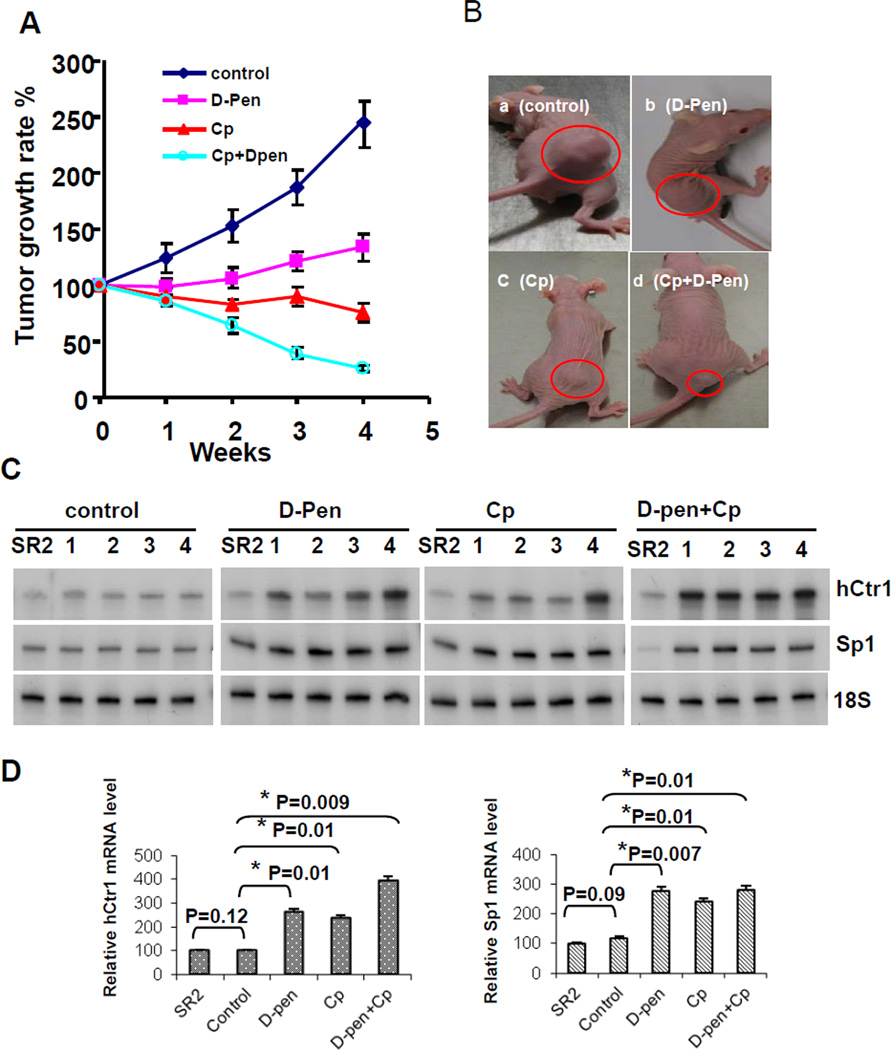
Fig. 5.
Enhanced cDDP-mediated inhibition of tumor growth by D-pen. (A) Growth rates measurements in four groups of animals. (B) Representative tumors in the treated animals from each group at the end of the treatment (circled). (C) hCtr1 and Sp1 mRNA expression in the residual tumors in each animal as determined by the RPA. (D) Statistical analyses of the hCtr1 (left) and Sp1 (right) expression results of RPA shown in (C).

