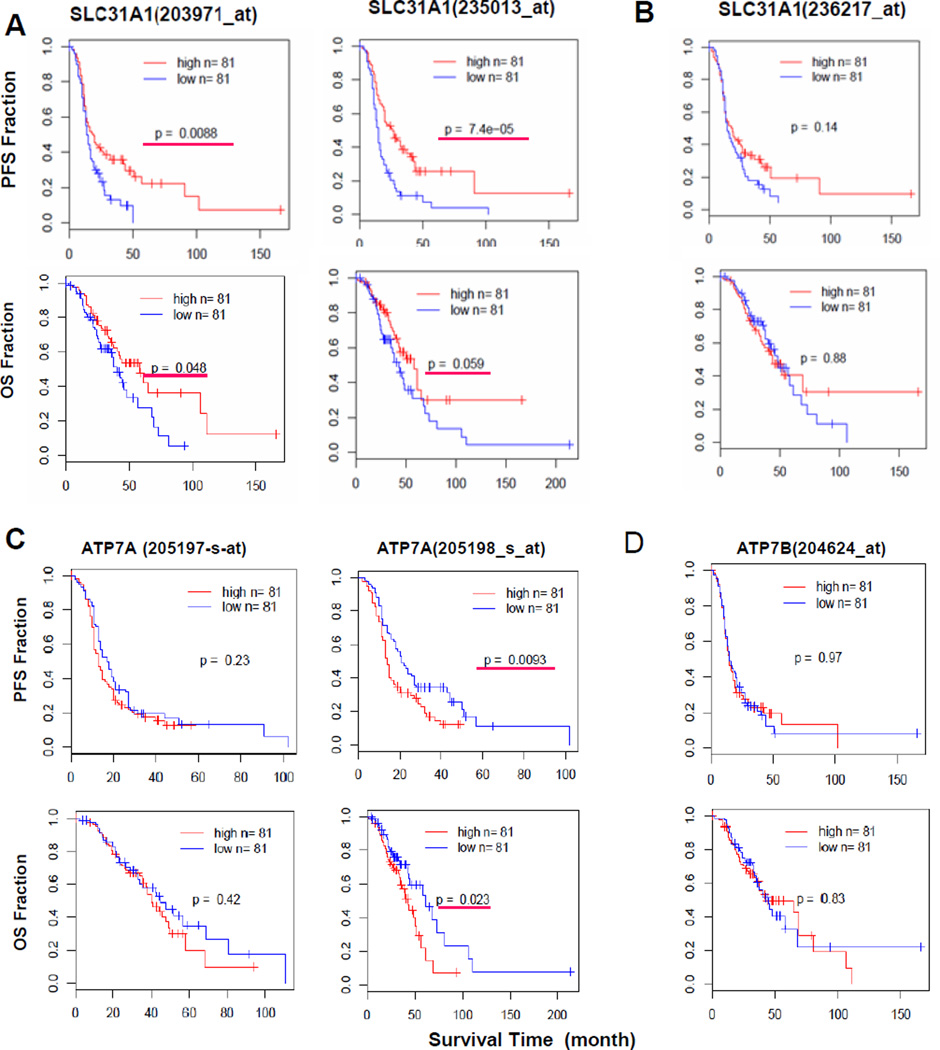
Fig. 6.
Correlation between Cu expression and the treatment outcomes in ovarian cancer patient using different gene probes. (A) hCtr1, (B) hCtr1-unrelated DNA sequence, (C) ATP7A, and (D) ATP7B. In all cases, probes for the given genes are indicated in parentheses, PFS results are shown in the upper panels and the corresponding OS results are shown in the lower panels, high expressers in each panel are shown as red lines and lower expressers are shown in blue, *, p ≤0.05 is considered as significant and is underlined by a red line.

