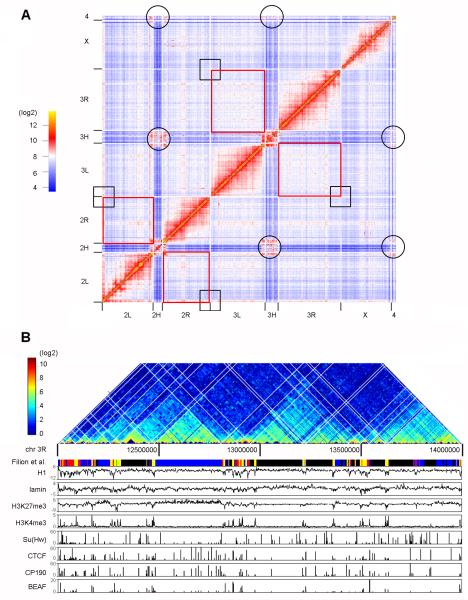
Figure 1. Partition of the Drosophila Genome into Physical Domains.
(A) Genome-wide interaction heat map at 100 kb resolution for the Drosophila genome in Kc167 cells. Black circles and squares show interactions between centromeres and telomeres, respectively. Red rectangles show interactions between chromosome arms 2L-2R and 3L-3R, respectively.
(B) Hi-C interaction frequencies displayed as a two-dimensional heat map at single fragment resolution for a 2 Mb region of chromosome 3R alongside with selected epigenetic marks and chromatin types defined by the presence of various proteins and histone modifications. The white grid on the heat map shows where the domains are partitioned.

