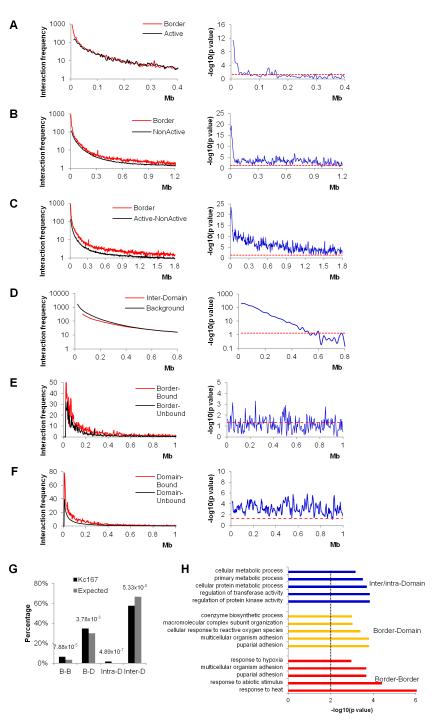
Figure 6. Long-range Interactions among Domain Boundaries.
(A) Interaction frequencies between boundary regions (Border, red line) compared to the genomic background active chromatin (Active, black line) are shown in the left panel. The right panel shows the p values for each distance examined (Wilcoxon test) with the red dashed line representing a p value of 0.05.
(B) Interaction frequencies between boundary regions (Border, red line) compared to the genomic background inactive chromatin (Non-active, black line) in the left panel. The right panel is as in (A).
(C) Interaction frequencies between boundary regions (Border, red line) compared to the genomic background active-inactive chromatin (Active-Non-active) in the left panel. The right panel is as in (A).
(D) Interaction frequencies between domain bins (Inter-Domain, red) compared to genomic background (Background, black) in the left panel. The right panel is as in (A).
(E) Interaction frequencies between fragments at boundary regions associated with BEAF, CTCF, CP190 and RNAPII simultaneously (Border-Bound, red) compared to fragments at boundary regions without the simultaneous binding of the four proteins (Border-Unbound, black). The right panel is as in (A).
(F) Interaction frequencies between fragments located inside of two different domains. Fragments associated with BEAF, CTCF, CP190 and RNAPII simultaneously (Domain-Bound, red) are compared to fragments without the simultaneous binding of the four proteins (Domain-Unbound, black). The right panel is as in (A).
(G) Percentage of interactions between boundary regions (B-B), boundary region and domain internal regions (B-D), inside domain (Intra-D) and between domains (Inter-D) identified at 20 kb resolution (black bars, Kc167). The same number interactions with the same size distribution as those identified experimentally were randomly created for each chromosome arm and reiterated 1000 times as a control (grey bars).
(H) Gene ontology analysis of genes involved in the interactions between Border-Border (red bars), Border-Domain (yellow bars) and Inter/intra-Domain (blue bars). The black dashed line indicates p=0.01.

