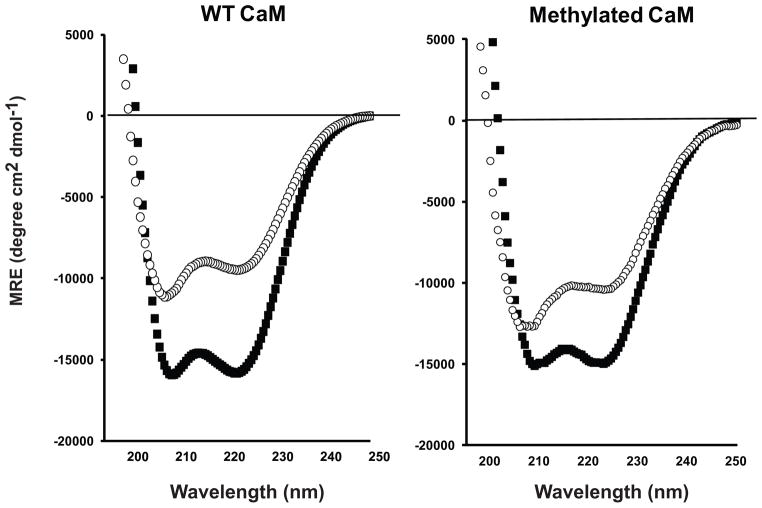
Figure 3.
Far-UV CD spectra of purified WT CaM and methylated CaM in the presence and absence of calcium. CD spectra for WT CaM (left) and methylated CaM (right), in 5 mM HEPES buffer pH 7.5, were recorded at 25 °C in the presence (+ 1 mM CaCl2, more negative spectra, filled squares) and absence (+ 1 mM EGTA, less negative spectra, open circles) of calcium. Additional CD measurements in excess CaCl2 and EGTA show no significant differences.

