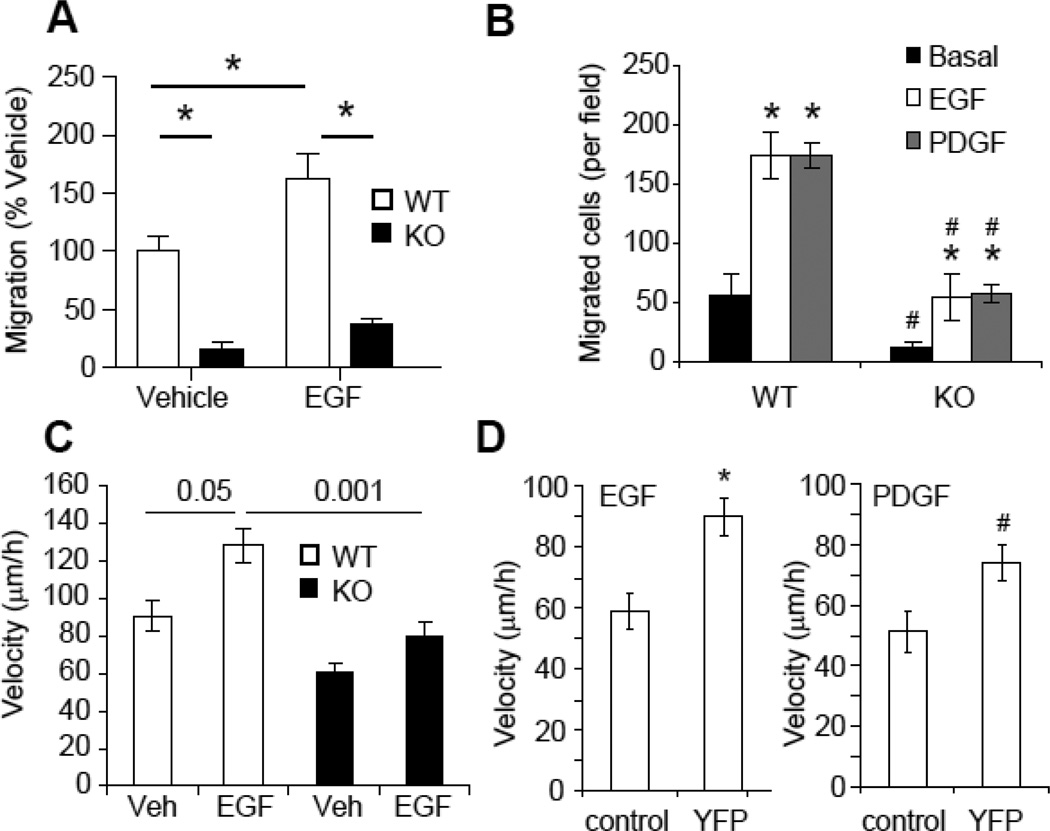
Figure 3. EBP50 regulates growth-factors-induced cell motility FA dynamic.
A. Monolayers of WT and KO cells were scratched and incubated in 0.1% FBS without (Vehicle) or with 10 ng/ml EGF. Cell migration was monitored over 20 h. Graph shows the mean values ± SE of recovered wound area relative to WT vehicle-treated cells. *, p< 0.05, N=4. B. Equal numbers (5 × 10⁴ cells) of WT and KO VSMC were plated on the upper compartment of a Boyden chamber and cell migration towards EGF (10 ng/ml) or (PDGF 10 ng/ml) was quantitated after 5 h at 37 °C. Graph shows the number of migrated cells. *, P<0.01 vs. basal; #, P<0.0004 vs. WT, N=4. C. Migration of isolated WT and KO cells was recorded in real time over 12 h in the absence or presence of EGF (10 ng/ml). Graph shows the average velocity of single WT and KO cells. P values are indicated, N=11. D. Migration of isolated WT VSMC electroporated with pcDNA3(control) or EBP50-YFP was recorded in real time over 12 h. Graph shows the average velocity of single cells in the presence of EGF (10 ng/ml) or PDGF (10 ng/ml). *, p<0.0007, #, p<0.004 vs. vehicle, N=7.

