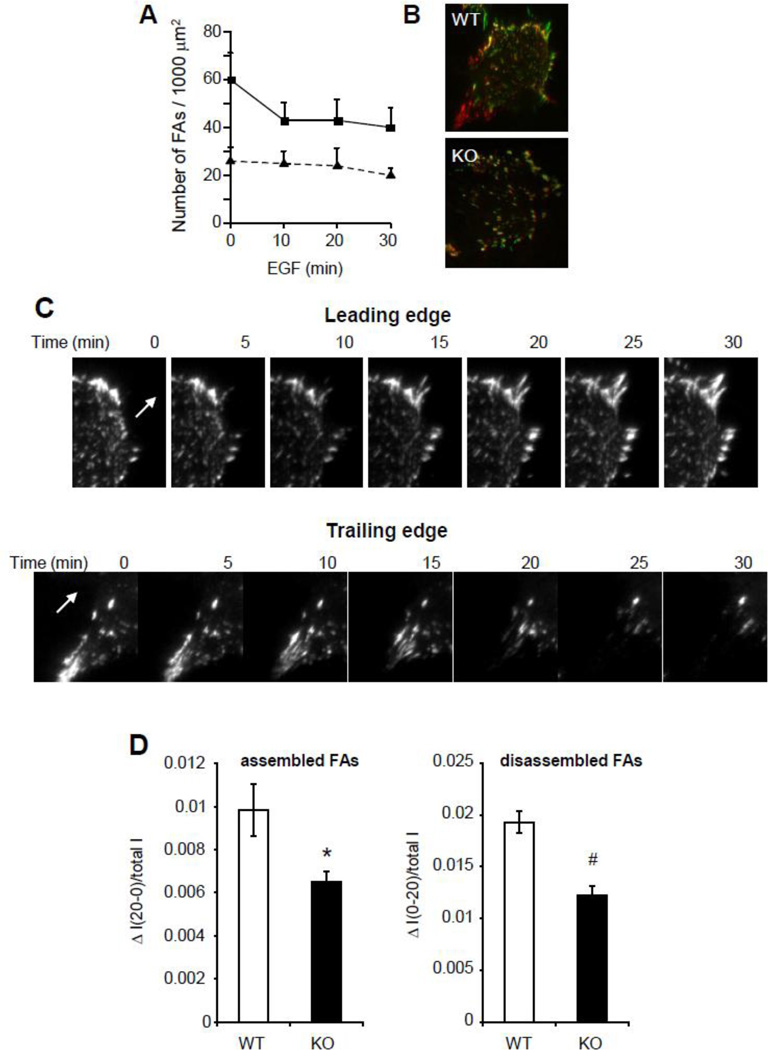
Figure 4. EBP50 regulates FA dynamic.
A. WT and KO VSMC infected with GFP-FAK adenovirus were plated on cover slips and incubated in 0.1% FBS overnight. GFP-FAK localization was monitored in real time by TIRF microscopy following treatment with 10 ng/ml EGF. Graph shows the average number ± SE of FAs per unit of cell area following EGF treatment. B. EGF-treated WT and KO cells expressing GFP-FAK were monitored by TIRF microscopy. Pictures of WT and KO cells were pseudo-colored in red (10 min after EGF) and in green (30 min after EGF) and merged. Green and red fluorescence represent newly assembled and disassembled FAs, respectively. Yellow fluorescence represents stable FAs. C. Representative images of the leading edge (upper panels) and trailing edge (lower panels) of VSMC expressing GFP-FAK and monitored every 5 min for 60 min by TIRF microscopy. The arrows indicate the direction of motion. D. Assembly and disassembly of FAs over 20 min was calculated in cells from D as described in the Methods. *, p<0.02 and #, p<0.002, N=10.

