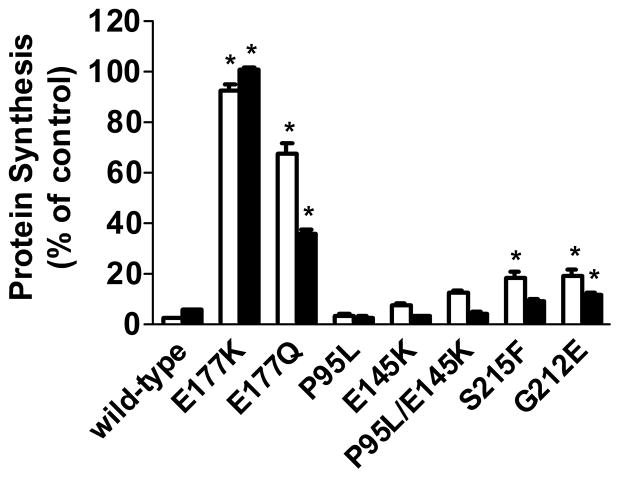
Figure 4.
Protein synthesis in cells transfected with endogenously expressed RTA and RTA mutants in MAC-T cells. Fluorescence was measured 21 h after co-transfection of RTA or RTA mutants and pEGFP. Fluorescence measured in cells co-transfected with pEGFP and empty vector was considered 100%. Each bar represents mean ± S.E. of three experiments, with each treatment performed in triplicate within an experiment. White bars = preRTA constructs; black bars = mature RTA constructs. Significance compared to pre or mature WT RTA is indicated as: *, P < 0.001; ‡, P < 0.05.

