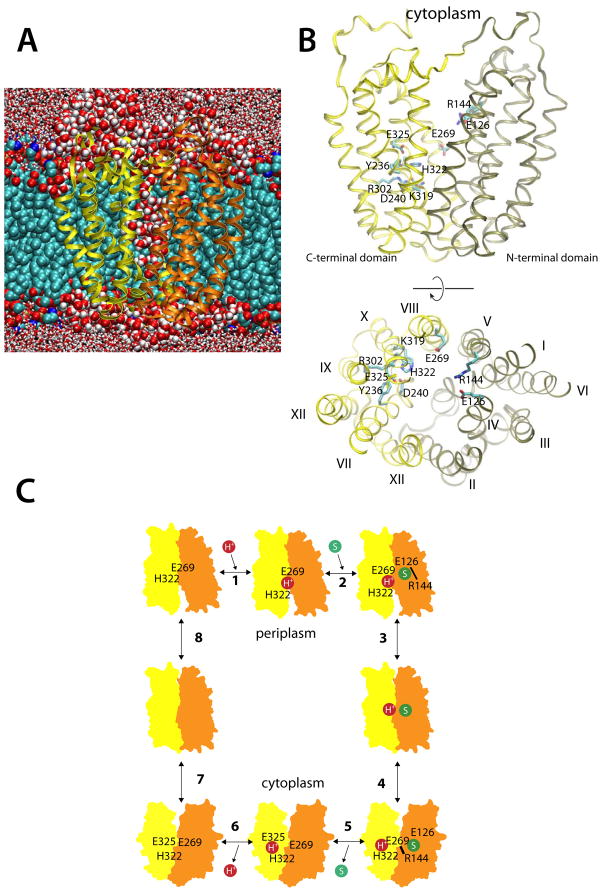
Figure 1.
Simulating LacY and the sites of H+ translocation and sugar binding. (A) A representative snapshot of the simulation cell. Here, LacY is shown inserted into a POPE bilayer; carbons (cyan), oxygens (red) and phosphates (brown) are represented by van der Waals spheres. The protein N- and C-terminal domains are colored tan and yellow, respectively. Water molecules within 5 Å are depicted as red and white van der Waals spheres, while water beyond this limit are licorice representations. (B) Side-view and top-view of the crystal structure of inward-facing wild-type apo LacY (PDB ID 2V8N), colored according the scheme in (A). Amino acid residues participating in H+ translocation and sugar binding are displayed as cyan licorice representations. (C) The eight-step LacY reaction scheme, where a proton (step 1) and a substrate molecule (step 2) binds to the outward-facing LacY state, which undergoes conformational change to face the cell interior (step 3–4). Substrate release (step 5) and deprotonation (step 6) then trigger the inward-to-outward transition (step 7–8). See also Figure S1.

