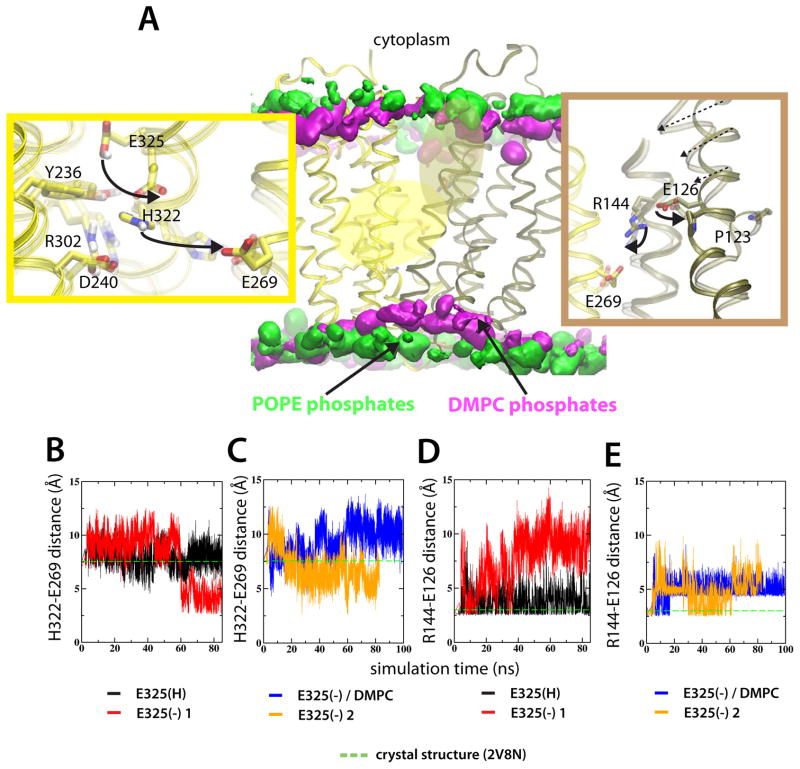
Figure 2.
Structural side-chain rearrangements in LacY are protonation-state dependent. (A) The middle panel shows LacY embedded in two different lipid environments. Lipid phosphates of the POPE and DMPC bilayers are represented by 5% isodensity surfaces in green and silver, respectively. The 5% occupancies correspond to the common surface in 5% of the simulation frames. Two high-dynamic regions are colored according to the closest domain; H+ translocating site and the sugar binding site is yellow and tan, respectively. Details of the H+ translocating site (left panel) and sugar binding site (right panel) show the average of the last ns of the E325(H) and E325(−) 1 simulations in POPE lipids, respectively. The evolution of the inter-atomic H322-E269 distance for the E325(H) and E325(−) 1 simulations (B) and E325(−) in and E325(−) 2 simulations (C), respectively. The corresponding E126-R134 distances are shown in (D-E). Distances in the crystal structure are represented as green, dashed lines. See also Figure S2–S4.

