Figure 3.
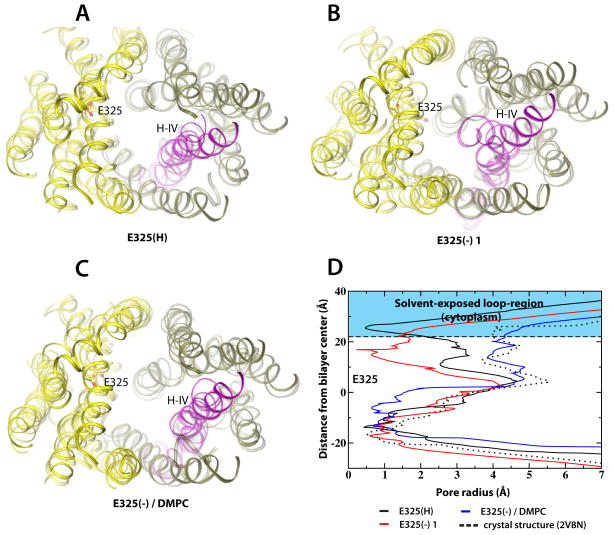
Conformational changes in LacY are protonation-state dependent. Structural changes in LacY are displayed by superimposing the starting structure (solid) on the final snapshot from the (A) E325(H), (B) E325(−) 1 and (C) E325(−)/DMPC simulations (transparent helices). Loop regions were removed for clarity. The N- and C-terminal domains colored in tan and yellow, respectively. Helix IV is depicted in magenta. (D) Pore radius analyses extracted using the program HOLE (Smart et al., 1993) of simulations E325(H) (black) and E325(−) 1 (red) and E325(−)/DMPC (blue). The pore radius of the crystal structure is shown for reference (dotted line). See also Figure S5.

