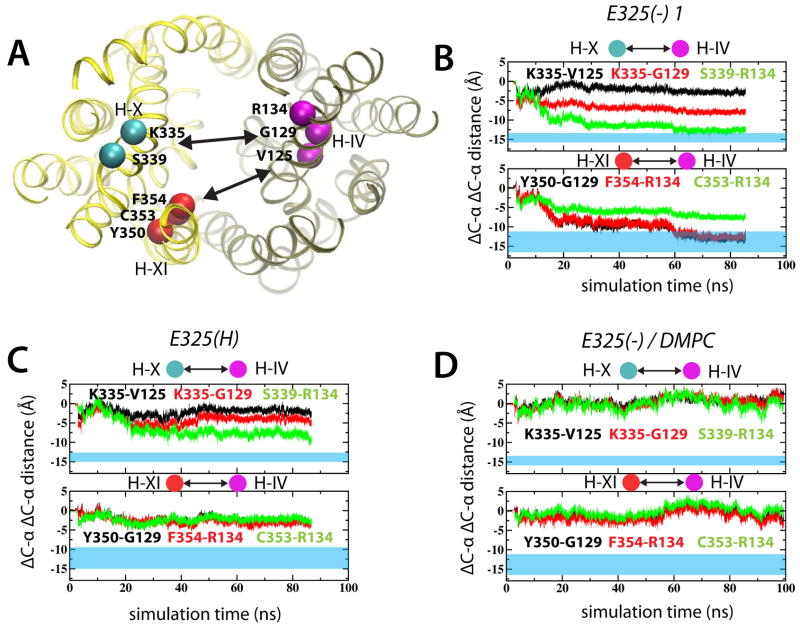
Figure 4.
Simulated conformational changes in light of experimental crosslinking data. (A) Specific positions used for crosslinking are marked by spheres in the 2V8N crystal structure. The change in distances between Cα in helices IV-X and IV-XI are shown for the E325(−) 1 (B) and E325(H) (C) simulations. (D) The corresponding distances for the E325(−)/DMPC simulation. The blue transparent regions correspond to experimentally measured distances. See also Figure S8.

