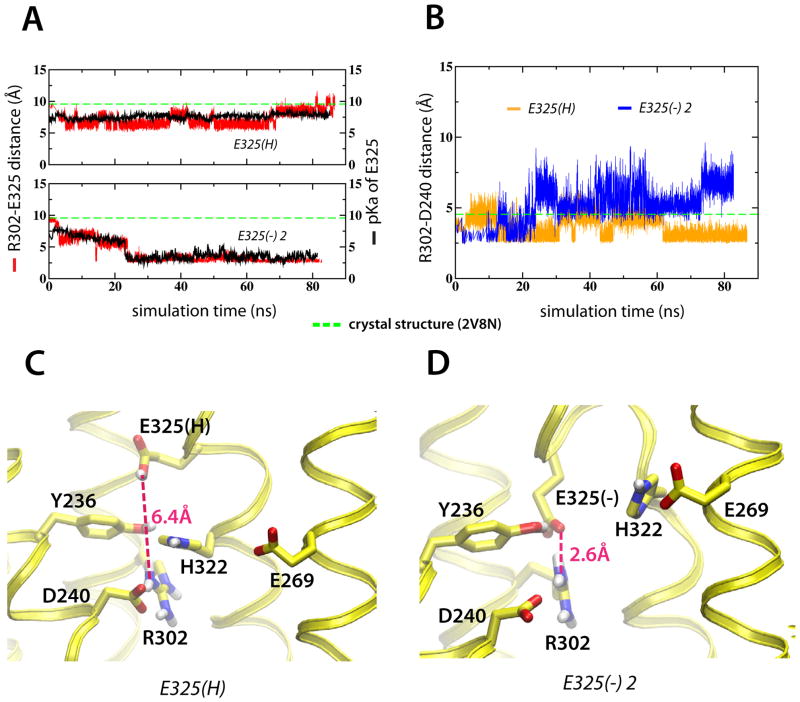
Figure 7.
Structural rearrangements in the H+ translocation site. (A) Inter-atomic distances between Arg302-Glu325 (red) and calculated Glu325 pKa (black) for the E325(H) and E325(−) 1 simulations, respectively. (B) Arg302-Asp240 inter-atomic distances for the E325(H) (orange) and E325(−) 1 (blue) simulations, respectively. (C–D) Structural arrangement in the H+ translocation site visualized by last ns averages from the E325(H) and E325(−) 1 simulations, respectively. See also Figure S6–S7.

