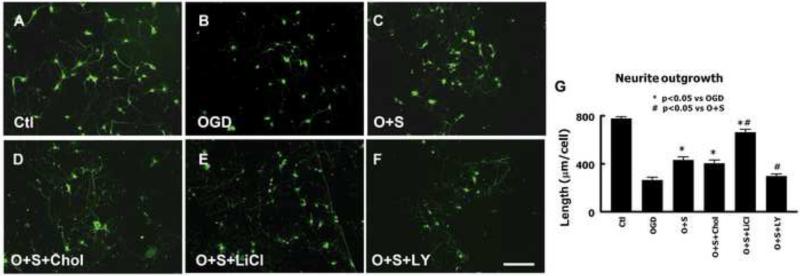
Fig. 5.
Immunofluorescent staining for TUJ-1 demonstrates neurite outgrowth of primary cultured cortical neurons in vitro under various treatments (A-F). Bar = 100 μm (for all panels). G: Bar graph showing the quantitative analysis of length of neurite outgrowth in variously treated groups, * P < 0.05 vs OGD, # P < 0.05 vs O + S. n = 4/group.

