Figure 6.
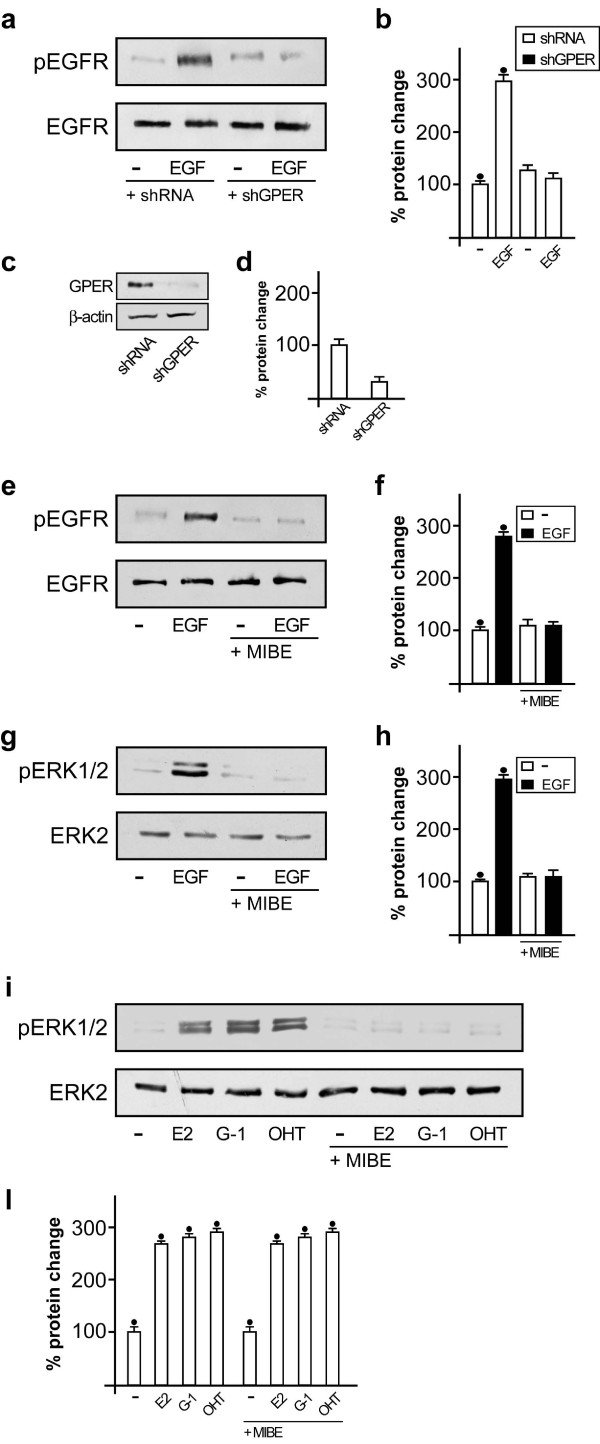
MIBE prevents the phosphorylation of EGFR and ERK1/2. (a) EGFRTyr1173 phosphorylation after treatment (five minutes) with vehicle (-) and 100 ng/ml EGF in SkBr3 cells transfected with shRNA or shGPER. (b) Densitometric analysis of three independent experiments, EGFRTyr1173 expressions are normalized to EGFR. (c) Efficacy of GPER silencing obtained using shGPER. (d) Densitometric analysis of three independent experiments. GPER expressions are normalized to beta-actin. (e) EGFRTyr1173 phosphorylation after treatment (five minutes) with vehicle (-) and 100 ng/ml EGF alone and in combination with 10 μM MIBE. (f) Densitometric analysis of three independent experiments. EGFRTyr1173 expressions are normalized to EGFR. (g) ERK1/2 activation in SkBr3 cells treated for five minutes with vehicle (-) or 100 ng/ml EGF alone and in combination with 10 microM MIBE. (h) Densitometric analysis of three independent experiments. ERK1/2 expressions are normalized to ERK2. (i) ERK1/2 activation in SkBr3 cells treated for 15 minutes with vehicle (-), 100 nM E2, 1 microM G-1 and 5 microM OHT alone and in combination with 10 microM MIBE. Data shown are representative of three independent experiments. (i) Densitometric analysis of three independent experiments. ERK1/2 expressions are normalized to ERK2. (•) indicates P < 0.05 for cells receiving vehicle versus treatments.

