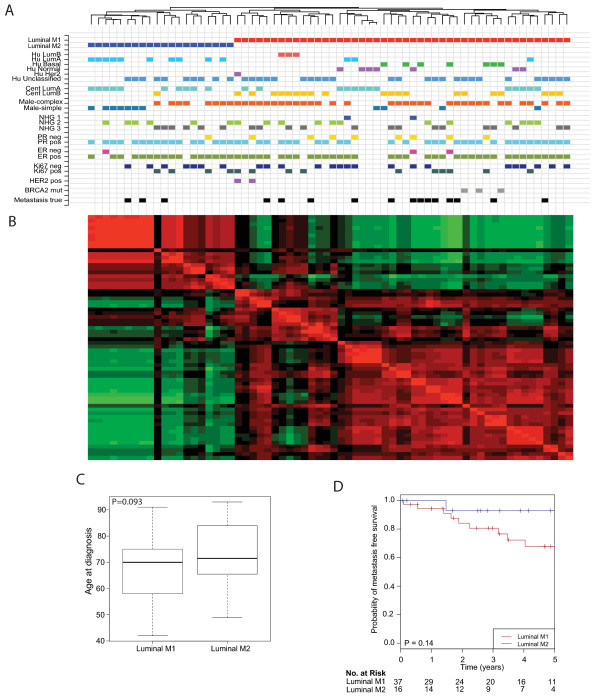
Figure 1.
Unsupervised hierarchical clustering (HCL) of male breast cancers based on 1,652 differential expressed genes. (A) HCL revealed two stable subgroups, luminal M1 (right) and luminal M2 (left). Annotations with the prefix Hu indicate the result of the centroid classification based on the Hu genes [21]. Annotations with the prefix cent were derived from the centroid classification with the genes for ER+ luminal female breast cancer (FBC). NHG, Nottingham histological grade. (B) Unsupervised HCL based on co-clustering frequencies revealed two stable subgroups. Co-clustering frequencies close to 1 are red, close to 0 are green and equal to 0.5 are black. (C) Difference in age at diagnosis between the subgroups. (D) Kaplan-Meier survival analysis suggesting better distant metastasis free survival (DMFS) in the luminal M2 subgroup. The numbers below the plot indicate the number of patients at risk in each group at the given time points.

