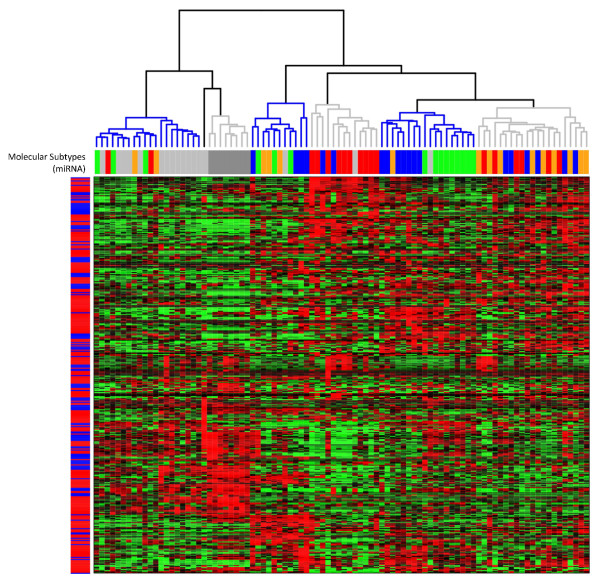
Figure 2.
Heatmap showing the result of an UHCA (Manhattan distance, Ward linkage) for all 373 miRNAs in all 92 samples. The miRNA-expression data are represented in matrix format, with rows indicating miRNAs and columns indicating samples. Overexpressed miRNAs are color-coded red, and repressed miRNAs are color-coded green. Color saturation indicates the level of overexpression. Six samples clusters could be discerned based on miRNA-expression differences, indicated by alternating blue and grey colors in the dendrogram. Underneath the sample dendrogram, the molecular-subtype classification is indicated (red, Basal-like; orange, ErbB2+; green, Luminal A; blue, Luminal B; gray, Normal-like). The true-normal breast samples are indicated by a darker shade of gray. The colored bar to the side of the heatmap indicates the array card to which the corresponding assay is allocated (red, A; blue, B).

