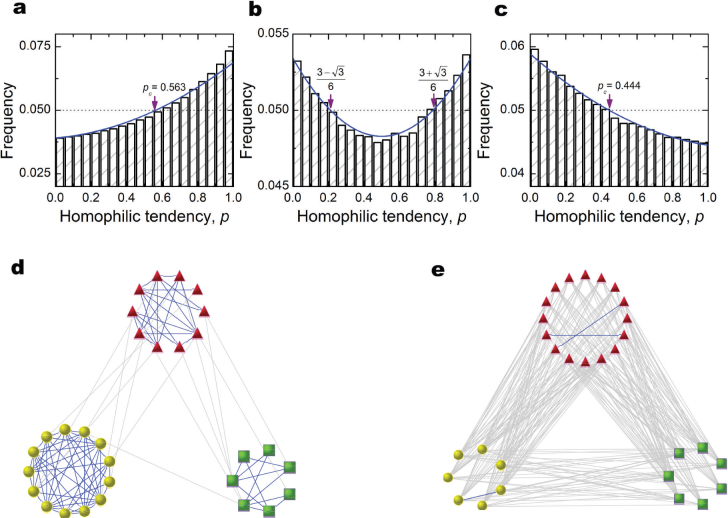
Figure 1. Equilibrium distribution of homophilic preferences, p, and the networks that result.
Solid blue lines in (a), (b), and (c) represent the theoretical distributions. Arrows show the theoretical critical point pc where the distribution crosses the uniform distribution (i.e., becomes more common or less common than expected due to chance). (d), (e), display networks of homophilic and heterophilic structures of social relationships that emerge from computer simulations of (a) and (c), respectively. Parameters: N = 30, β = 0.005, M = 3, u = 0.04, v = 0.06, (a, d) a = 1, b = 0.1, (b) a = 5/9, b = 1, (c, e) a = 0.1, b = 1. Results are averaged over T = 109 time steps.

