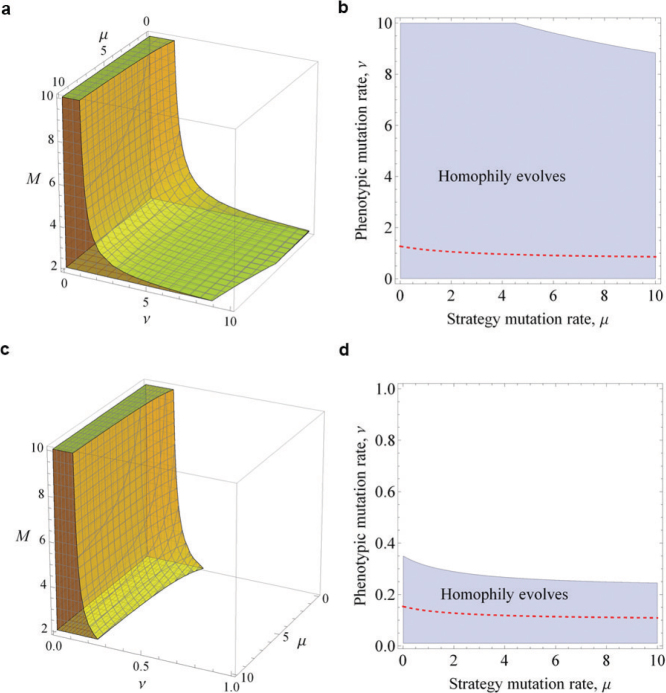
Figure 4. The full set of conditions under which homophily evolves.
The coloured 3D regions in (a), (c) show the combinations of parameters (µ, ν, M) that allow natural selection to favour homophily for given payoff values: (a) a = 3/4, b = 1 and (c) a = 1/10, b = 1. Corresponding to (a) and (c) respectively, the shaded areas in (b), (d) denote the set of parameters (µ, ν) favouring homophily with the number of phenotypes, M = 2. The boundaries of these shaded areas shrink to the dashed red lines, as M increases to ∞. Homophily evolves even if a ≪ b, as long as the mutation rates are low.

