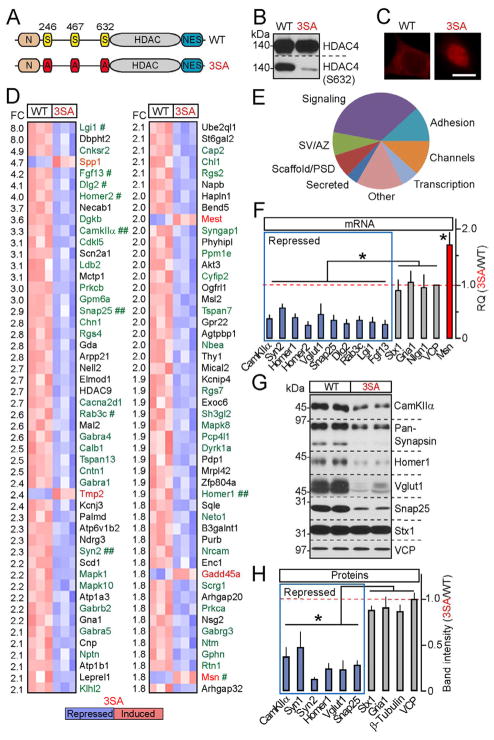
Figure 2. HDAC4 represses genes essential for synaptic function.
A–E, Genome-wide mRNA profiling of cortical neurons expressing wildtype HDAC4 or the constitutively nuclear 3SA mutant. A, Schematic representation of HDAC4 domain structure. B and C, Expression, phosphorylation and localization of wildtype and 3SA HDAC4 was analyzed by immunoblotting with conventional and phospho-specific antibodies (B), and by immunostaining (C). D, DNA microarray heat maps of the top 100 differentially expressed transcripts. The magnitudes of fold change (FC) are indicated on the left. Genes encoding synaptic proteins are shown in green. Symbols mark hits whose regulation was confirmed by qPCR (#) and/or qPCR and immunoblotting (##). E, A diagram depicting HDAC4-dependent genes grouped into distinct categories based on localization and function of encoded proteins. SV=synaptic vesicle; AZ=active zone; PSD=postsynaptic density. See Figure S2 and Tables S1 and S2 for additional details and raw microarray data.
F, qPCR analysis of mRNA levels of genes identified by microarrays (shown in blue and red) and various controls.
G and H, Protein expression levels were examined by immunoblotting. In panels (F) and (H), averaged values from three independent experiments were plotted as 3SA/WT ratio. All data are represented as Mean±S.D. * = p<0.05.

