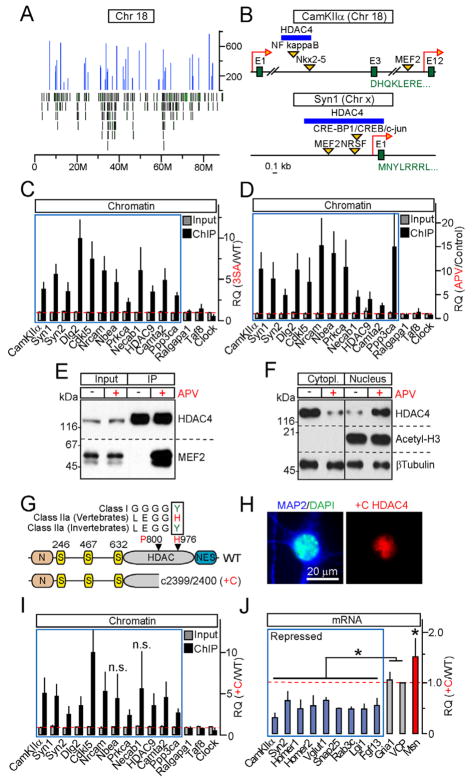
Figure 3. HDAC4 associates with chromatin and MEF2 in an activity-dependent manner, and represses transcription without employing its catalytic domain.
A, Distribution of HDAC4-interacting loci (blue peaks) across chromosome 18. Green bars mark positions of individual genes.
B, Positions of HDAC4-binding sites within CamKIIa and Syn1 genes.
C, Chromatin was co-immunoprecipitated with wildtype or 3SA HDAC4 and analyzed by qPCR with primers specific for loci identified by deep sequencing (blue box) and various controls. Data are plotted as 3SA/WT RQ ratio.
D, qPCR analysis of wildtype HDAC4 interaction with its target sites in control neurons and neurons that were incubated for 12 hours with APV. Data are plotted as APV/Control RQ ratio.
E, NMDA receptors regulate the binding of HDAC4 to MEF2. HDAC4 was immunoprecipitated from control and APV-treated neurons. Protein complexes were analyzed by immunoblotting with antibodies to HDAC4 and MEF2.
F, Re-distribution of HDAC4 from the cytoplasm to nucleus does not affect the levels of acetylated histone H3. Subcellular fractions of control and APV-treated neurons were separated by centrifugation, and analyzed by immunoblotting with antibodies to native HDAC4, Acetyl-H3 and βTubulin.
G–J, A mutant HDAC4 allele associated with Brachydactyly mental retardation syndrome is a constitutively nuclear gain-of-function transcriptional repressor. G, Domain structures of wildtype HDAC4 and +C allele. Sequence alignment illustrates evolutional inactivation of vertebrate class IIa HDACs. H, A protein encoded by +C allele accumulates in neuronal nuclei. I, +C mutant constitutively binds to genomic loci that are occupied by wildtype HDAC4 in an activity-dependent manner (blue box). qPCR analysis was performed as described in Figure 3C. J, mRNA levels of HDAC4-regulated genes (shown in blue and red) and controls were measured by qPCR and plotted as +C/WT RQ ratio.
All qPCR data are represented as Mean±S.D. from RQ values obtained in three independent sets of experiments. * = p<0.05. See also Figures S3 and S4.

