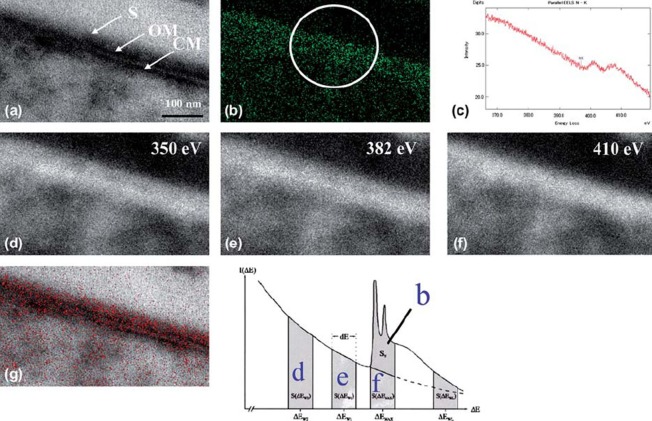
Fig. 5.
ESI using three-window method and parallel-EELS for T. forsythensis cells incubated in DAB medium with H2O2 and DAB. Nitrogen distribution corresponded to the outermost cell surface, the S-layer. a) Zero-loss transmission image. b) Background removed net ΔEmax 410 eV. c) Parallel-EELS analysis of the circled area in Fig. 5b. d) The second window of ΔEw2 350 eV t. e) The first window of ΔEw1 382 eV of nitrogen. f) ΔEmax 410 eV of K edge of nitrogen. g) Superimposed image of nitrogen distribution over the zero-loss image. CM, cytoplasmic membrane; OM, outer membrane; S, S-layer.

