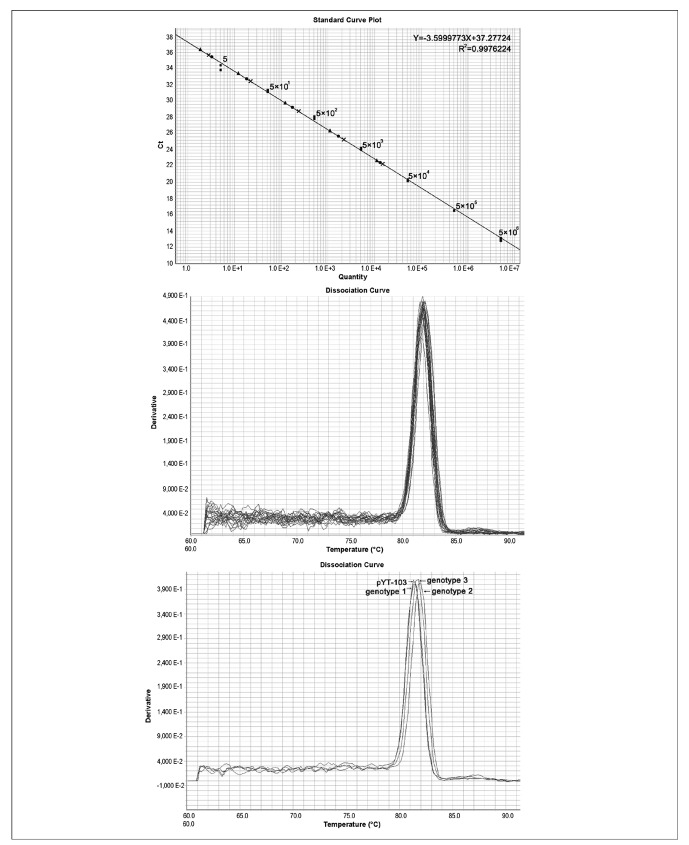
Figure 1.
Q-PCR to determine the specificity and the sensitivity of the detection system. (a) Standard curve generated by a serial dilution (10x) of plasmid pYT-103 (■), from 5 to 5×10⁶ copies per reaction (20 μL), and a serial dilution (10x) of three B19V genotypes from 2 to 2×10⁴ IU per reaction (20 μL) of the 1st WHO International Reference Panel for Parvovirus B19 Genotypes for NAT-based assays [genotype 1 (●), genotype 2 (x), and genotype 3 (▲)] were tested for the lowest detection limit; (b) Melting curve of B19V-positive samples; (c) Melting curve of three genotypes of B19V with plasmid pYT-103.

