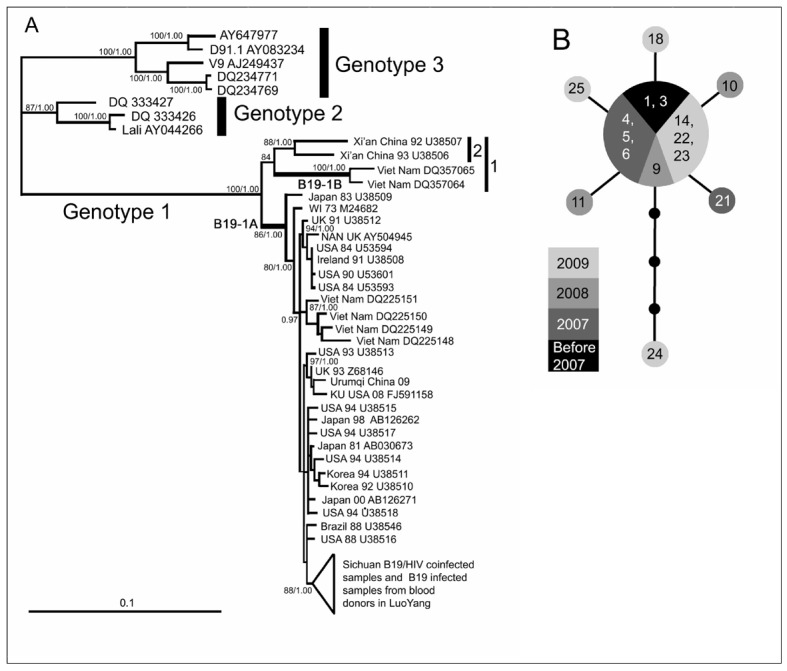
Figure 3.

Phylogeny and haplotype analysis. (a) Bayesian inference (BI) tree estimated using an aligned 4060 bp sequence. Maximum likelihood bootstrap values >80 and BI posterior possibilities >0.95 are shown at the nodes. The GenBank accession number, collection time and locality of each reference sequence are shown at the tips. (b) Median-joining network depicting the relationships among B19/HIV co-infected samples. Grey circle: B19 DNA positive samples; Black circle: Missing intermediates. Each branch between two (sampled or missing) haplotypes indicates a single mutational step. The size of each circle is proportional to the corresponding haplotype frequency. The numbers shown in the circles correspond to the samples’ serial numbers in Table II.
