Figure 1.
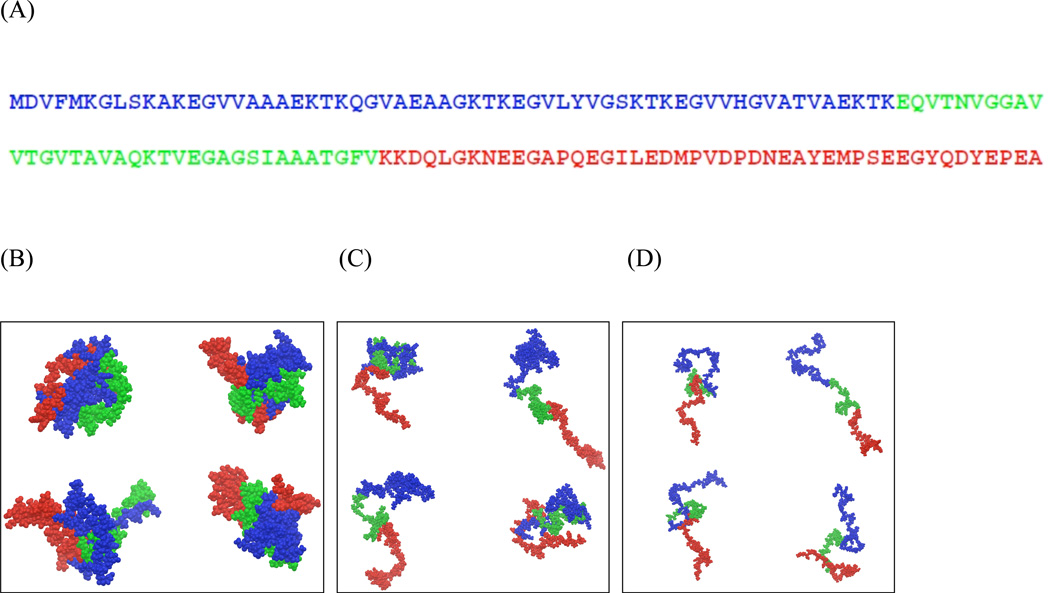
(A) Primary sequence of human α-synuclein. The N, NAC and C-terminal regions are represented in blue, green and red respectively. (B–D) Representative conformations of α-synuclein selected for the low (B), intermediate (C), and high temperature (D) ensembles. The representative structures were chosen based on the top four clusters, determined using the hierarchical clustering method 101. The color scheme used here are the same as that in A.

