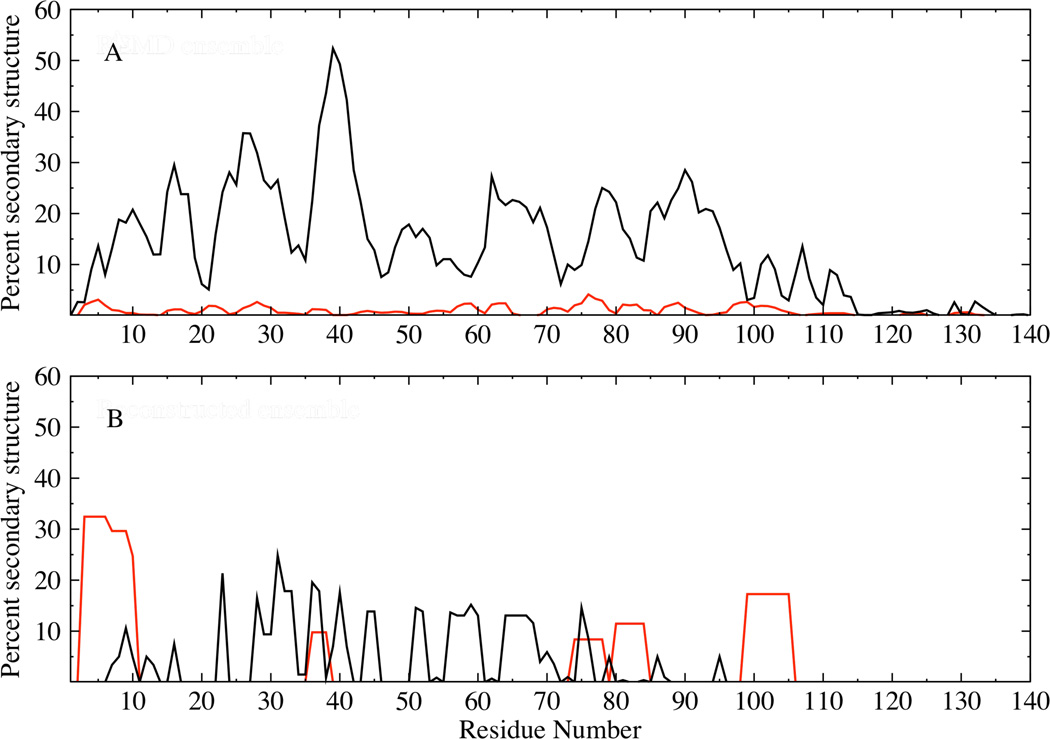
Figure 10.
Ensemble averaged helix (red) and beta strand (black) propensities for the original REMD (A) and reconstructed (B) α-synuclein ensembles. Helix propensities were calculated by combining the alpha pi and 3–10 conformations, while the strand propensities were obtained by combining the extended and bridge conformations 77.

