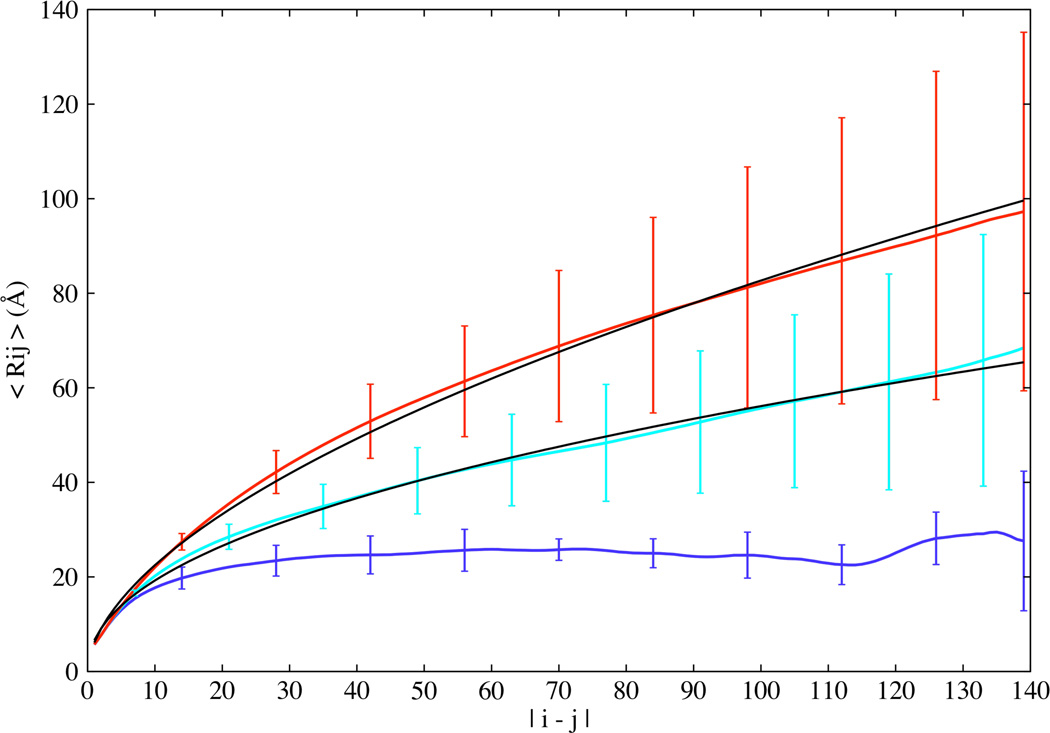
Figure 3.
Scaling of average internal distances (Rij) plotted as a function of sequence separation |i–j| for the low (blue), intermediate (cyan), and high (red) temperature ensembles. The fits to the intermediate and high temperature ensembles, shown as solid lines, have scaling exponents of 0.46 and 0.57 respectively. Error bars represent standard deviations displayed here only for select residues along the sequence for clarity.

