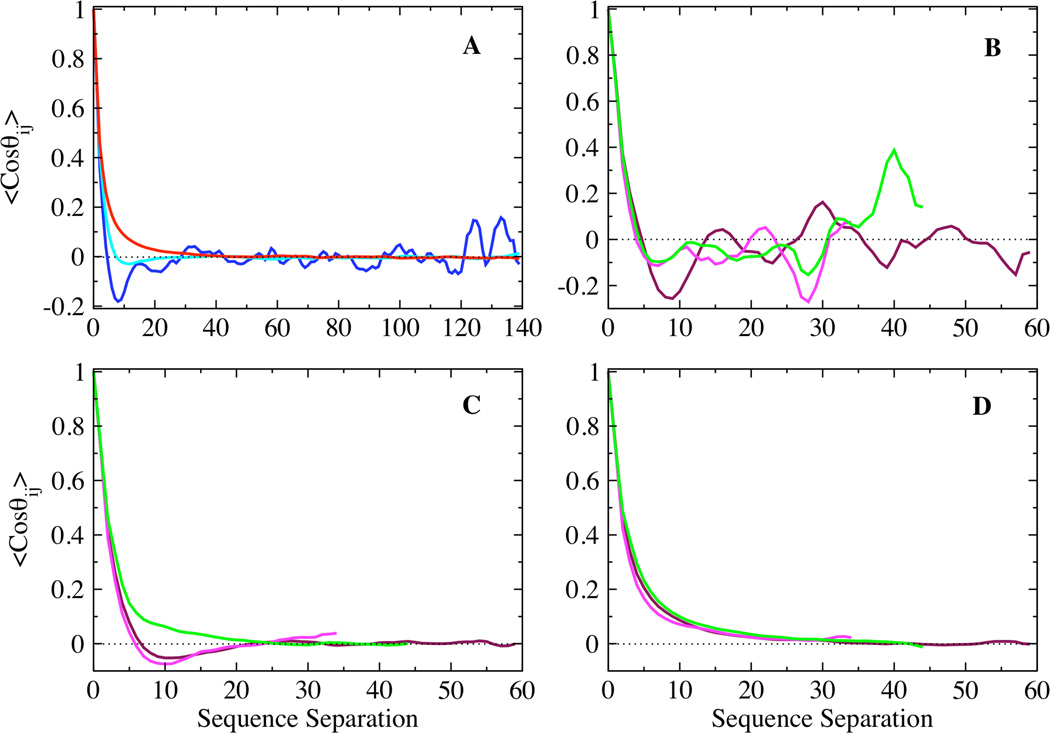
Figure 4.
Ensemble averaged angular correlation function plotted as a function of sequence separation for the (A) low (blue), intermediate (cyan), and high (red) temperature ensembles, and the N (maroon), NAC (magenta) and C (green) terminal domains of the (B) low, (C) intermediate, and (D) high temperature ensembles.

