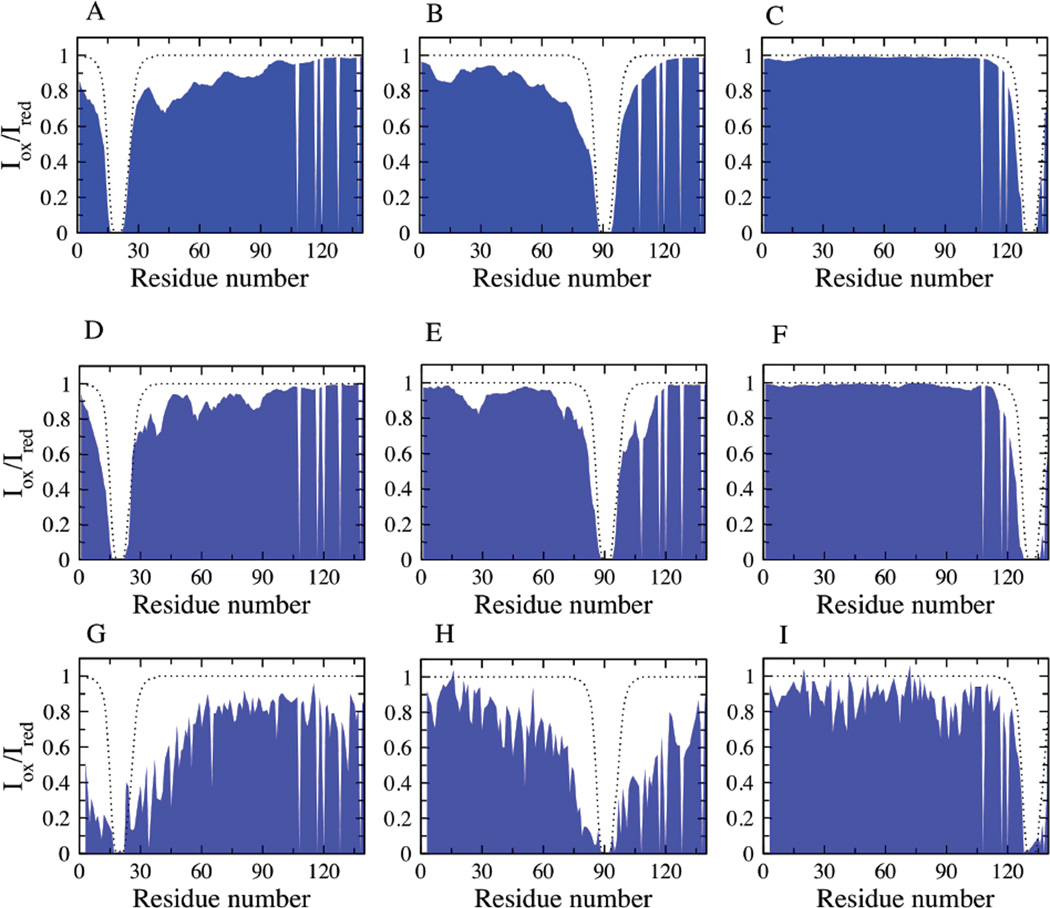
Figure 7.
Conformational characteristics of the simulation ensembles correlating with experiment: PREs for the REMD ensemble (A, B, C), reconstructed ensemble (D, E, F) and NMR experimental data (G, H, I) for spin label at positions A19, A90 and G132 respectively. The dotted lines represent the theoretical PRE values calculated for α-synuclein with no long-range contacts, determined as described previously 21.

