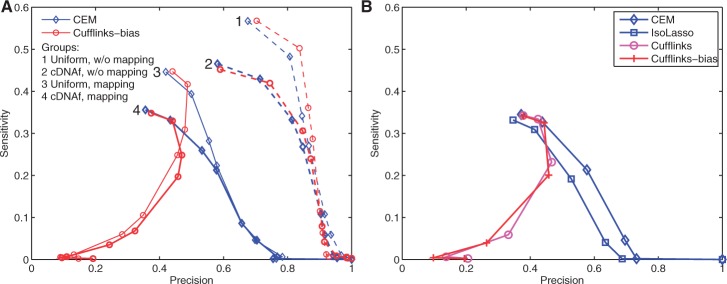
Fig. 1.
Sensitivity–precision curves of both CEM and Cufflinks-bias on four datasets (A) and a comparison of four different algorithms (B). 80 million 75 bp single-end RNA-Seq reads are generated, and Figure 1A shows the effect of both positional and mappability biases on CEM and Cufflinks-bias. Here, ‘w/o mapping’ means that correct read locations are provided and ‘mapping’ uses Tophat to map reads to the reference genome. Figure 1B compares four different programs for transcriptome assembly, including CEM, IsoLasso, Cufflinks and Cufflinks-bias. Here, the curves for CEM and Cufflinks-bias correspond to those in group 4 of Figure A

